Mr Price (JSE: MRP) recently announced that South Africa’s energy crisis and associated load shedding wreaked havoc on its financial performance, resulting in a staggering revenue loss of approximately R1 billion for the full financial year ended on 1 April 2023.
The retailer’s core trading divisions suffered a severe blow in the financial year’s second half, particularly during the festive season when load shedding struck with unprecedented intensity, resulting in an annual loss of 318,000 trading hours.
Being a local value retailer, Mr Price had exercised caution when investing in backup power, as historical experiences with load shedding had been somewhat manageable. However, the dire situation took an alarming turn after September 2022, with power outages escalating to unparalleled levels, eclipsing the cumulative quantum of the previous 15 years.
South Africa’s heightened energy crisis and inadequate alternative energy sources resulted in an estimated loss of 318,000 trading hours, equivalent to roughly R1 billion in revenue.
With only 37% of Mr Price’s core business possessing backup power utilities by the end of September 2022, the heightened levels of rolling blackouts took a significant chunk out of the retailer’s top line, paving the path for implementing energy continuity plans. Indirectly, the repercussions of load shedding extended to customer behaviour, leading to diminished consumer confidence and a pressing need to reduce unsold stock levels, further curtailing the company’s top and bottom-line figures.
Despite load shedding ticking down throughout the winter period, much to the surprise of many local consumers, the power crisis is far from over. To combat this dire energy situation, Mr Price has implemented energy continuity roll-out plans and a substantial investment of R220 million in backup power systems.
Fundamental Analysis
- Despite the adversity caused by loadshedding, Mr Price achieved a commendable revenue growth of 17% year-over-year, amounting to R32.85 billion for the financial year ending 1 April 2023. Notably, this figure includes the acquisition of a 70% stake in the Studio 88 Group in October 2022. Despite robust revenue growth amidst a period rife with extensive power disruptions, the effects of load shedding during the festive period resulted in a modest 5.4% year-over-year increase in the retailer’s annual EBITDA, coming in at R7.2 billion for the latest financial year. Furthermore, the group’s headline earnings per share (HEPS) figure declined by 6% year-over-year, reaching 1,205.70 cents, down from 1,282.10 cents for the prior year. Moreover, basic earnings per share (EPS) declined by 6.8% year-over-year, arriving at 1,210.70 cents, down from 1,298.60 cents.
- Headline earnings per share (HEPS) increased from 1,100.10 cents for the 2018 fiscal year to 1,205.70 cents for the 2023 fiscal year, translating to a five-year compound annual growth rate of approximately 1.9%. Dividends per share (DPS) increased from 693.10 cents in 2018 to 759.60 cents in 2023, implying a five-year compound annual growth rate of 1.8%. Over the same time horizon, from 2018 to 2023, Mr Price has maintained the same dividend payout ratio of 63%, excluding the 2020 financial year, where it decreased its payout ratio to 29.7%. Despite retaining the same payout ratio, the group reported a 5.9% year-over-year dividend per share (DPS) decline from 2022 to 2023.
- Notably, the retailer’s profitability and gearing ratios – return on net worth, return on average equity, return on capital employed and return on operating assets – all sit at their lowest levels when analysing the time horizon spanning from 2018 to 2023.
- The group’s return on net worth currently sits at 23.9%, down from 27.8% in 2022, while its return on average equity sits at 24.8%, down from 29.2% in 2022. Moreover, the retailer’s return on capital employed comes in at 23.1% for the latest fiscal year, lower than the 27.3% reported in 2022. Return on operating assets comes in at 51% for the 2023 financial year, significantly down from the 74.6% reported for the 2022 fiscal year.
- Over the same period, Mr Price reported their weakest current and quick ratios, with the former coming in at 1.6x for the 2023 financial year, significantly down from 3.1x reported in 2018 and 2.5x reported in 2022. The group posted a quick ratio of 0.6x for the latest financial year, significantly down from 2.2x in 2018 and 1.6x in 2022. Amidst South Africa’s dire energy situation, suppressed consumer sentiment, and rising interest rates curtailing customer spending, the retailer’s inventory turnover ratio comes in at 3.4x for the 2023 financial year, the lowest reading in over five years. Mr Price reported a total liabilities to total shareholder equity ratio of 1.1 for the 2023 fiscal year, significantly higher than the 2018 reading of 0.4 and the 2022 reading of 0.9. When looking at the six years spanning from 2018 to 2023, the 2023 reading of 1.1 is the highest across all six years, implying a significant reduction in solvency. The gradual weakening of the group’s current and quick ratios over the period spanning from 2018 to 2023 indicates an overall decrease in liquidity levels.
- Delving into the group’s cash flow statements, net cash inflows from operating activities surged by an impressive 23.6% year-over-year, coming in at R5.94 billion for the financial year ending 1 April 2023, up from R4.81 billion in the prior fiscal year. Cash generated from operations increased by 9.7% year-over-year, coming in at R6.26 billion for the 2023 financial year.
- Looking ahead, Mr Price anticipates continued challenges in the trading environment for the first six months of the 2024 fiscal year. While consumer price inflation (CPI) decreased slightly from 6.8% in April to 6.3% in May, the group emphasises that subsequent interest rate hikes have not significantly curbed inflation. As a result, consumers are shifting their spending toward non-discretionary items.
Comparative Analysis of Share Prices: Mr Price, Truworths, and The Foschini Group
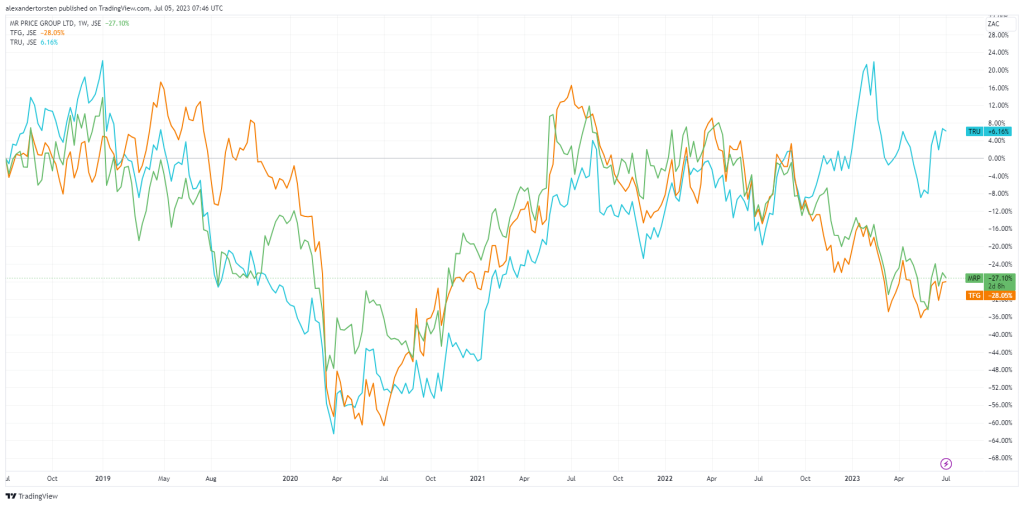
- Over the past five years, Mr Price (JSE: MRP) and The Foschini Group (JSE: TFG) have seen their share prices underperform relative to Truworths (JSE: TRU).
- The price chart below displays the dismal five-year share price performance of Mr Price (green line) and The Foschini Group (orange line), returning -27% and -28% to shareholders, respectively. Over the same period, Truworths (blue line) has produced a measly 6% to shareholders.

Technical Analysis
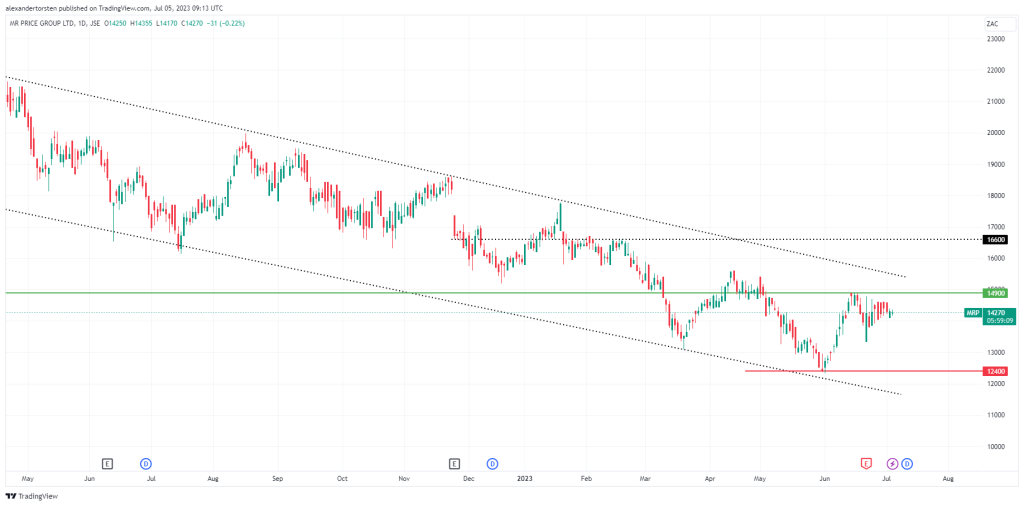
- Looking at the daily price chart of Mr Price, the price action has been under bearish pressure, trading lower in a descending channel since April 2022. Despite testing the primary support level at R124 per share (red line) towards the end of May 2023, the price action increased toward higher levels, testing the R149 per share (green line) resistance level in June but failing to break above that level.
- The bulls will look for the share price to break above the R149 resistance level, a share level towards the R166 per share (horizontal black dotted line) resistance level, which could prevail as a level of interest for bullish investors and traders alike. The bears will look for the share price to decline toward the primary support level at R124 per share, which could be in play if negative sentiment persists or macroeconomic headwinds worsen.

Sources: Business Tech, Koyfin, Moneyweb, Mr Price Financial Statements, Trading View


