Tuesday, April 29, 2025
Home Blog Page 188

Cryptocurrency: Inflations’ power over consumers widens while the case for gaining exposure to cryptos grows

  • A basket of goods in 2013 grew by 36% in just 4 years, due to inflation
  • The deflationary power of cryptos such as BTC and ETH reflects the financial shift that we are witnessing today
  • Blockchain research house Glassnode, shows that BTC holders are in this for the long-term

Unlike rands or any other traditional currency, Bitcoin is designed to have a limited supply, so it can’t be devalued by a government or a central bank distributing or creating too much of it. While over the past few years, the traditional currencies we use have diminished our buying power, while those who opted for digital currencies have seen an increase in theirs.

To illustrate this point, we took a basket of goods from a decade ago and escalated the prices by the consumer inflation rate. Assuming that basket of goods cost R5,000 in 2013, by early 2022 it had nearly doubled in price to R9,375.

Using BTC as the currency, that same basket would have cost 4.75 BTC in 2013 and today, it costs 0.01 BTC.

Ethereum, the second-largest crypto as measured by market cap, has been around since 2015 so we have less data to work with. The ETH price was extremely volatile in the first two years of its creation, climbing from about R3,000 in early 2017 to just short of R20,000 in early 2018, before collapsing more than 90% to around R1,200 later that year.

Then Ethereum began its steady but inexorable climb to above R75,000 in late 2021, before giving up some of its gains. In April 2022, it traded at R47,000.

Our R5,000 basket of goods had escalated in ZAR to R6,800 by 2017. If we used Ether as the purchasing currency, it would have cost 1.65 ETH in 2017 and then more than doubled in price to close to 4 ETH in 2019. That same basket of goods today would cost 0.21 ETH.

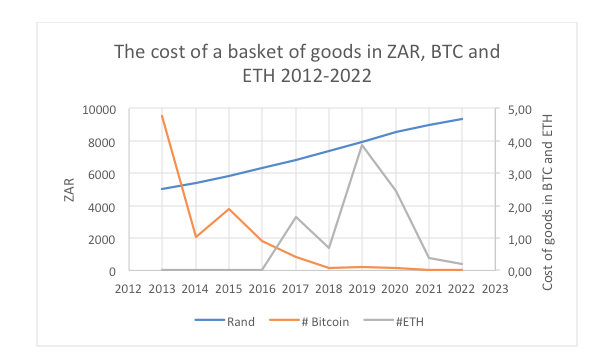
Source: Jaltech, StatsSA

Bitcoin and Ethereum have entirely different use cases: Bitcoin is regarded as a digital store of value, while Ethereum is challenging financial orthodoxy through the use of blockchain and smart contracts.

Bitcoin has been dismissed time and again by many of the titans of Wall Street, among them Warren Buffet and JP Morgan Chase’s CEO Jamie Dimon, who called it a ‘fraud’ and ‘worthless’, yet the number of corporate investors present at the recent Bitcoin Conference in Miami suggests cryptos are here to stay. There will be some spectacular failures along the way, but virtually all major banks now have at least one or two analysts dedicated to studying and following cryptos. They dedicate their time to identifying the tracking the winners, such as BTC and ETH.

Graphs like the one above can no longer be dismissed by serious analysts. The deflationary power of cryptos such as BTC and ETH reflects the financial shift that we are witnessing where annual interest yields of 20% or more are being earned on decentralised finance (DeFi) platforms, where collateralised loans can be taken out without having to submit so much as a name or email address, where transactions can be settled in seconds rather than days. Where credit committees and bank managers are rendered irrelevant.

The growth in crypto value will never be a smooth line, but crypto enthusiasts are accustomed to this. After peaking above R300,000 in 2017, BTC dropped 84% in price over the following year, before reversing the trend and shooting above R1 million. ETH dropped more than 90% in 2018 before screaming back up more than 2,000%. The peaks and troughs are often extreme, but the same volatility was evident in the early years of Amazon and Apple stock trading. It is already clear that both ETH and BTC are far less volatile today than was the case just a few years ago.

Blockchain research house Glassnode shows that BTC holders are increasingly in this for the long haul. They can now stake their coins – putting them to work on the blockchain for which they earn rewards – and they can borrow against their cryptos to leverage their positions. In other words, the case for owning cryptos is getting more compelling by the month.

Jonty Sacks – Partner at Jaltech


For information about Jaltech’s Cryptocurrency Basket, click here.

Jaltech offers everyday people effortless and convenient access to the cryptocurrency market.

One of Jaltech’s investments is its Cryptocurrency Baskets which is tailored for investors who are looking for an investment option that provides investors with exposure and diversification across protocols, digital currency and blockchain technology.

Renergen’s life is still a gas

There were two announcements released by Renergen yesterday. One was a formal financial report and the other was an excitement-filled update on progress at the Virginia Gas Project. Nobody can ever accuse Renergen of not injecting a little passion into SENS.

The financial report in question is a preliminary report on the year ended February 2022. As I often remind you, the company’s valuation is not based on anything you’ll find in the income statement. The key Virginia Gas Project is still being brought into operation, which is why Renergen gives such frequent and detailed updates on its progress.

Revenue was just R2.6 million and the loss attributable to shareholders was R33.8 million. See what I mean?

Operating costs decreased by R6.8 million thanks to lower consulting fees and employee costs, along with swings in net foreign exchange. The benefits were mitigated to some extent by listing costs and other legal and professional fees.

In September 2021, Renergen made a final drawdown of R112.1 million on the loan facility from the US International Development Finance Corporation. The local Industrial Development Corporation (IDC) gave Renergen a loan facility of R160.7 million in December 2021, of which Renergen has used R158.8 million. Developing a resource production facility isn’t a cheap exercise.

The real story behind the company is found beyond the financials. Renergen has been busy securing LNG and helium offtake agreements and has enjoyed 5 out of 6 drilling successes from the exploration campaign.

To give more context to the achievements, offtake agreements with Consol Glass and a subsidiary of Italtile have already covered 60% of planned phase 1 production of LNG. The remaining 40% is going to the logistics market in a dual fuel application for heavy trucks.

On the helium side, 65% of planned phase II production has already been contracted under take-or-pay contracts that are between 10 and 15 years in length. The group is hanging on to the rest, with an intention to place it in the spot market.
In and amongst all this, Renergen also developed a transportation solution for vaccines called Cryo-Vacc. Demand for vaccines has fallen off a cliff, but Renergen may be able to find a market for the technology in verticals like gene therapy and similar niches. Renergen spent R10.9 million developing this solution, so they need to generate a return somehow. It pales in comparison o the R260.7 million on the Virginia Gas Plant in this period but is still a meaningful number.

Renergen had R95 million in unrestricted cash reserves at the end of the period. Subsequently, Ivanhoe Mines subscriber for shares for over R200 million. A much larger deal is the planned sale of 10% of Renergen’s operating subsidiary to the Central Energy Fund for R1 billion. The proceeds will be used for the phase II development.

The share price is up 18% this year and over 60% in the past twelve months.

Do we take Central Bank guidance at face value?

  • Central banks talk the talk

Central banks use verbal guidance as a tool to prompt financial markets to adjust long before a policy-changing decision is taken and implemented. Forward guidance, as it is referred to, has been used as a tool more often by central banks following the 2008 financial crisis and involves providing information about its future monetary policy intentions based on its assessment of the outlook for price stability. This aims to influence the financial decisions of economic actors by providing a guidepost. The greater the credibility of the central bank, the greater the market response, and the heavier the burden of self-regulation that is carried by the financial markets to moderate the cycle.

One must think about the interplay between financial markets and the yield curve a little more deeply to fully appreciate the power of this tool. It also means that a central bank need not act as tough as it communicates, and therein lies the conundrum for investors. Should they take the central bank at face value, or should they rather focus on how much the underlying bond market has already priced in and achieved in moderating the cycle? The answer is always a bit of both.

  • Forward guidance has a pre-emptive impact in the markets and the real economy

The Fed this year has taken on a notably more hawkish stance towards its monetary policy, with this peaking recently when Chair Powell suggested that more than one 50bp rate hike could be on the cards for this year. The market has responded with the USD surging, while UST yields have climbed to highs not seen since 2019. This rise for UST yields has been more concentrated along the front end of the curve, flattening it out to the extent that the curve inverted over the 10v2 spread briefly at the start of April.

The fact that interest rates over the short-term have risen to near longer-term rates suggests that the market sees heightened near-term economic risks. These risks have come from the expectation that the Fed will hike rates aggressively over the coming months, choking liquidity in the market and effectively tightening financing conditions already without the Fed actually hiking aggressively yet.

This hawkish forward guidance will also send a message to financial officers of companies that interest rates are set to rise, impacting the decision to roll over debt. Higher interest rates in the near term will make rolling over debt less attractive as it will have to be repriced at a higher rate. If options are limited and revenues are weak, debt may need to be rolled over regardless, leading to higher debt servicing costs which will threaten the longer-term profitability and growth prospects of a company.

The tightening effect that this hawkish talk has in the real economy can already be felt, with US mortgage rates surging to over 5.00% recently. This compares to levels closer to 3.00% at the start of the year. This more than 200bp increase for 30-year fixed mortgage rates has come while the Fed has hiked, until now, by only 25bp. This perfectly illustrates the power that forward guidance can have, and that the aggressive talk with regard to tightening monetary policy can manifest in the markets as tighter financial conditions without rates actually being hiked so aggressively. These higher mortgage rates have already translated into lower house prices and weaker sales, as reflected in the chart below:

  • Bottom-line:

Global central banks have drastically stepped up their aggressive hawkish communication in order to prepare the markets for the tightening of monetary policy. The markets, therefore, have priced in a future of lower liquidity and higher interest rates, effectively doing some of the work of the central banks for them. However, the Fed and its peers will need to follow through with their hawkishness to some degree and hike after this aggressive guidance to ensure their credibility. Otherwise, the market will begin ignore future guidance, limiting its impact and forcing even greater policy moves in the future to achieve the desired policy goal.

EOH updates pro forma numbers

EOH has released updated pro forma financial effects related to the disposal of the Information Services Group. In simpler terms, this means that the company is helping investors understand what the financial picture will be after the latest sale of assets to help settle debts.

EOH has been managing to dispose of its “intellectual property” assets at EBITDA multiples of just over 5x. This leaves behind the core businesses of iOCO (an ICT distributor and systems integrator) and NEXTEC, focused on people outsourcing solutions and intelligent infrastructure.

When the Information Services Group deal was initially announced, the pro forma effects were based on EOH’s results for the year ended July 2021. As these are outdated and differ from the latest results by more than 10%, EOH is required under JSE rules to provide updated pro forma effects.

“Pro forma” just means that the accountants present numbers at a specific date as though the transaction had gone ahead, even though it hadn’t. In this case, EOH has used 31 January 2022.

On this assumption, Headline Earnings per Share (HEPS) would’ve been 34 cents instead of 41 cents, as the company has sold off some of its earnings. Net asset value per share would’ve been 108 cents instead of 114 cents.

To give an idea of how much trouble the balance sheet is still in, net tangible asset value per share (i.e. excluding intangible assets like goodwill etc.) would be negative 380 cents per share.

These updated pro forma numbers should be read in conjunction with the deal circular. You can read this here

Impala Platinum volumes under pressure

Impala Platinum has released a production report for the three months ended 31 March 2022, which represents the third quarter of the financial year. Mining companies have been disappointing the market in the past couple of weeks, with production numbers taking knocks from supply chain issues and Covid-related disruptions.

Gross group concentrate production fell 2% in this quarter and tonnes milled fell by 4%, so Implats wasn’t immune to issues. Refined 6E production fell by 8%, impacted by lower concentrate volumes, while 6E sales volumes declined by 3%.

There was a general reduction in stock levels in the comparable period (especially in iridium and ruthenium). This period also saw some destocking of inventory (evidenced by a lower impact on sales than on production volumes).

With a nine-month lens, Implats has seen a 6% decrease in gross refined 6E concentrate production. This is attributable to more maintenance needing to be done in this period than in the prior period. Sales volumes of 6E fell by 4% with the same destocking explanations applying.

Impala Rustenburg had a particularly rough quarter, with production down 10%. Numerous issues including safety stoppages, cable theft, electricity curtailment (I assume this means load shedding) and community disruptions were at play. Over nine months, refined 6E production fell 16% with the additional impact of maintenance.

Zimplats achieved marginal improvements in this quarter. 6E matte production in the nine-month period was 2% higher than the comparable period.

In smaller operations, Marula achieved a 5% increase in 6E concentrate production this quarter and is up 9% for the nine-month period. Mimosa saw a 6% decrease in production in this quarter and for the nine-month period. Despite numerous issues, Two Rivers increased concentrate production by 7% in the quarter and flat volumes for the nine-month period.

Looking abroad, Impala Canada experienced a 4% drop in concentrate production in this quarter. The nine-month result is a 3% drop in production.

The IRS operation achieved 5% growth in refined 6E production in this quarter, with higher deliveries from third parties helping to offset delays from Mimosa and Zimplats. Over nine months, mine-to-market receipts dropped by 3% and third-party and toll receipts were slightly higher. The announcement doesn’t indicate a percentage change in production over the longer period.

And in case you’ve been living under one of the rocks at the mines, Impala Platinum is in the process of acquiring Royal Bafokeng Platinum via an offer to shareholders. Impala holds around 37.79% in Royal Bafokeng thanks to shareholders who already accepted the offer. The offer is still open.

Importantly, guidance for the full year that was provided at the time of the interim results has been reiterated.

Strong market demand at Industrials REIT

The world’s most practically-named REIT has released a trading update for the fourth quarter of its 2022 financial year, which covers the January – March period.

The fund experienced a record quarter for deal volumes i.e. leasing transactions. This means that demand remains strong for multi-let industrial space in the UK. 53% of completed leases were structured as the REIT’s short-form digital “Smart Leases” which is encouraging for the platform. Driving leasing enquiries through the company website means that the company is engaging directly with tenants rather than working through third party agents or portals.

Importantly, average rent increased 22% for the quarter, which is a number that office and even retail funds can only dream of. Uplift was as high as 34% on new lettings! This is the sixth quarter where average uplifts on new lettings was over 20%.

These uplifts only apply to renewed and new leases, of course. Looking across the entire portfolio, like-for-like rent increased by 1.5% during the quarter and met the goal of 4% to 5% growth per annum.

The average lease term granted increased from 4.2 years to 4.9 years, with the average rent-free incentive up from 1 month to 1.2 months.

The fund executed GBP21 million of acquisitions in this quarter and has a strong pipeline of opportunities. The acquisitions are being executed below replacement cost.

After the end of the quarter, a further deal of GBP3.1 million was executed on a net initial yield of 5.2%. A further two industrial estates are under offer with a combined value of GBP7.2 million.

The loan to value ratio at the end of March was 31%.

The share price has fallen 8.6% this year and is 10.5% higher over the past 12 months.

Clicks is struggling in wholesale

The Clicks share price is flat this year, so it’s been a much better investment than the US tech companies that the market got too excited about in 2021. Like those companies, Clicks trades on a substantial multiple.

The market sees this as a defensive stock, which I’ve always found a little odd as the model has significant reliance on selling small appliances in the so-called “front shop” – the part of the store unrelated to the dispensary. Margins on pharmaceuticals are regulated and aren’t terrible exciting, so the magic for shareholders happens between the pharmacist and the queue in the front of the store.

If I look at the pain and agony inflicted on Massmart shareholders by a disruptor like Takealot, it’s not obvious to me why the small appliances business at Clicks won’t face the same pressures. Only time will tell.

In the latest period, Clicks’ turnover from continuing operations only increased by 9%. This was good enough to increase continuing diluted HEPS by 20.1% and the interim dividend by 26.3% to 180 cents per share.

If you adjust for the second SASRIA insurance payment, diluted HEPS from continuing operations only grew by 10.2%.

The reason for reporting results from continuing operations is that Musica was closed in May 2021. That business is therefore in the base, so Clicks effectively excludes it to give a meaningful comparison.

The Covid-19 vaccination programme has been great for Clicks, with the store network helping with a national roll-out of vaccines. The group has administered over 3 million vaccinations since the start of the programme.

As we dig deeper into the turnover number, we find that retail sales grew by 13.6% and distribution turnover only increased by 0.6%. I would interpret this as the effect of the vaccinations, as that would be captured in the retail sales but not in the distribution sales. I can’t think of another reason why the difference would be so large.

Vaccinating people is a low margin business, so retail margin was negatively impacted by 40bps. Distribution margin increased by 20bps despite the low revenue growth.

Retail costs grew by a substantial 12.2% due to growth in the business, with costs on a like-for-like basis increasing by 6.5%. The impact of inflation is clear.

Margin pressure in UPD is becoming a real issue. Distribution costs increased by 8.4% based on higher fuel, security, insurance and electricity costs. Compared to practically no growth in distribution revenue, that’s a proper headache for management that might take more than over-the-counter pills to cure.

The overall impact on margins is a 20bps decrease in group adjusted operating margin to 7.8%.

On the plus side, inventory days decreased which means that less cash was tied up in stock. Cash generated from operations was R590 million and capital expenditure was R352 million, considerably higher than R269 million in the comparable period.

Share buybacks were R446 million and dividends of R848 million were paid. At period end, the group held cash resources of R838 million.

The second half of the year will be supported by a further 28 stores being opened. Although the vaccination programme is ongoing, I suspect that the bulk of the revenue from that initiative has already been made.

The biggest risk in my eyes is UPD, the wholesale business. Clicks notes that normalised activity (including at hospitals) will be positive for UPD’s customers. Shareholders will certainly hope that this will be the case!

With a planned capital expenditure bill of R876 million for the full year, shareholders should pay close attention to the level of free cash flows in the business. Return on equity of 47.2% is excellent and means that the company generates economic profits by investing shareholder capital, but the focus should actually be on return on incremental invested capital, a number that very few companies ever report. It’s worth doing some research on the concept if you are serious about your investing.

Clicks expects diluted adjusted HEPS from continuing operations for the year to be between 8% and 13% higher than in FY21. This implies a level between 904 cents and 946 cents.

With a share price of R320, this is a forward Price/Earnings multiple of around 35x

Karooooo needs long-term belief

I have a long position in Karooooo (i.e. I own the stock) that I initiated a couple of months before the big announcement came of a migration to the Nasdaq (back when it was called Cartrack).

Since then, the company has been growing revenue at solid rates but this hasn’t translated into profit growth, as the cost of acquiring a customer is high. It takes many months for Karooooo to achieve break-even on a new customer. In a period of high customer growth, this causes a decrease in profit margins.

The latest quarter does include a swearword in this economic model: churn. That’s not what I want to see. Customers need to come onto the platform and stay there for a few years, otherwise Karooooo loses money on new customers. The company attributes this to financial pressure on customers from the pandemic.

The latest financial update by the company is for the fourth quarter of the 2022 financial year. It includes the numbers for the full year as well.

By the end of February 2022, Karooooo had 1,525,872 subscribers vs. 1,306,000 a year prior. This is a 16.8% increase in subscriber numbers over 12 months. As noted above, the impact on margins is negative, with gross profit margin decreasing from 71% in FY21 to 68% in FY22. The company believes that gross margin can increase in FY23. I certainly hope it will!

For the year, operating profit in the Cartrack business increased by just 1% to R731 million. Growth initiatives Picup and Carzuka incurred operating losses of R3 million and R13 million respectively. The net result was a decrease in earnings per share of 3%. With once-offs removed, it would’ve increased by 1%.

In the last quarter of the year, total revenue increased by 20% year-on-year to R742 million. This is a similar growth rate to revenue for the full 2022 financial year.

The expectation for the 2023 financial year is subscriber numbers between 1.7 and 1.9 million, subscription revenue between R2.95 billion and R3.1 billion and adjusted EBITDA margin in Cartrack of between 45% and 50%.

The group has R718 million in cash after raising R349 million when it listed on the Nasdaq in April 2021. R70 million was used to acquire Picup in September 2021.

Free cash flow of R379 million in 2022 was down from R460 million in 2021. This puts the group on a lofty free cash flow multiple of around 40x, so growth needs to be maintained.

Disclaimer: The Finance Ghost holds shares in Karooooo

Netcare is the perfect example of operating leverage

In a voluntary trading update for the six months to March 2022, Netcare announced that it achieved revenue growth of between 2% and 2.5%. You’ll probably agree that even the hospital food is more exciting than that.

The business was impacted by the Omicron variant in December and January. As I’ve written several times before, the pandemic was negative for hospital groups. As counterintuitive as it seems, the reason is that elective surgeries were impacted and this affected occupancy levels in the hospitals.

Despite this modest revenue growth, EBITDA margin still increased. This gives us insight into the extent of operating leverage in hospitals, as small improvements in utilisation can drive growth in profits. Occupancy in February and March averaged 62.4%. Another benefit to EBITDA margin was a drop in Covid-19 protective equipment expenditure.

Group EBITDA increased by between 8.5% and 9%, with normalised EBITDA margin improving by 100bps to 15.8%. If I understood the SENS correctly and if strategic project costs are excluded, the margin was 16.8%. At all times, I would treat normalised margins with suspicion as an investor. If strategic projects are required on a regular basis for the group to compete, then they shouldn’t be ignored by investors.

Net debt to EBITDA has improved over the past twelve months from 2x to 1.7x. The latest number is in line with the September 2021 (interim) level. In absolute terms, debt has declined from R6.1 billion to R5.4 billion in the past year. The group has cash resources and undrawn committed facilities of R3.4 billion.

I was saddened to note that March 2022 saw the highest mental health occupancy levels since the start of the pandemic. This is the true legacy of the virus and the response to it by governments around the world. We’ve really been through a lot.

Moving to segmentals, Hospitals and Emergency Services grew revenue by between 2% and 2.5% and EBITDA by between 7.7% and 8.2%. EBITDA margin of 15.5% was well up on the comparative interim period (14.7%) and FY21 at 15%.

In Primary Care (e.g. medical and dental clinics), revenue growth was between 5.2% and 5.7%. This drove a substantial increase in EBITDA of between 30% and 32%, with the effect of operating leverage clearly visible. EBITDA margin expanded from 18.4% to 23% year-on-year.

In terms of strategic projects, the 427-bed Netcare Alberton hospital opened in April and construction of the 36-bed Akeso Richards Bay facility is complete. Another project highlighted in the announcement is the CareOn electronic medical record project, with 20 hospitals on track to be completed by the end of 2022.

ESG enthusiasts will also be pleased to learn that Netcare is the only healthcare institution in the world to win Gold Medals in all four categories of environmental sustainability in the global Health Care Climate Challenge.

The share price is slightly lower this year and just 4% up in the past twelve months. It has traded in a range between R14 and R16 in the past 6 months.

South32 production on track but there are cost pressures

It’s been a rough week or so for mining production numbers, so a quarterly report from South32 may have been met with some nervousness from the market. This is a good time to remind you that the JSE attracts mining companies with operations all over the world, so pressures in South African production don’t translate into pressures on businesses with offshore operations.

With that out the way, it may make more sense to you that South32 released unchanged production guidance for FY22, with operations delivering according to plan. The group operates in Australia, Southern Africa and South America. It’s a bit like the old days of Super Rugby.

With a pre-feasibility study completed for the zinc-lead-silver Taylor Deposit in Arizona, the group also looks set to expand in the northern hemisphere.

South32 has reported strong quarterly production results in aluminium, copper, zinc, nickel and coal. Manganese production fell due to planned maintenance at the South African mines. This is the first time the group has reported copper production, now that the Sierra Gorda investment has been completed.

Supply chain issues are in play here, particularly in the aluminium value chain where movement of inventory at operations has slowed down. The company is obviously mitigating this to the greatest extent possible.

With freight pressures, higher raw material input prices and major currency movements, guidance for operating costs per unit has been revised higher.

Capital expenditure guidance has been reduced by USD36 million to USD702 million, attributable to a deferral of spend at Worsley Alumina into FY23 among other things.

At the end of March, South32 had cash of USD52 million after acquiring a 45% interest in the Sierra Gorda copper mine for USD1.4 billion during the quarter. This was funded by USD600 million cash and USD800 million from a short-term acquisition bridge facility. The bridge was repaid after the end of this period through the company’s inaugural USD bond issuance, in which USD700 million in senior unsecured notes (due 2032) were issued. These carry an interest cost of 4.35% per annum.

A group like this is always busy with deals. For example, the sale of the Metalloys manganese alloy smelter is not proceeding and will remain on care and maintenance for now. In better news, the group received approval from the Brazilian Competition Authority for the acquisition of an additional 18.2% interest in the Mineracao Rio do Norte bauxite mine, taking the ownership stake to 33%.

Finally, South32 is no longer selling commodities to Russian entities. Exposure to the country has historically been limited and no new business relationships are planned.

Verified by MonsterInsights