Glencore is on track for full year production, but the second half will be critical
Shaftesbury Capital’s London West End strategy keeps paying off
Valterra Platinum just banked the third highest interim profit in company history
Hungry to learn as much as possible? Check out my latest YouTube video explaining Boxer and Vodacom’s growth:
ArcelorMittal: from bad to worse (JSE: ACL)
Things can always get worse than they already are
Whenever I read an ArcelorMittal trading statement or set of financial results, I imagine that this is what it must be like for the finance team writing the announcement:
In the six months to June 2026, ArcelorMittal has shown us once again that things can always get worse than they already are. In the comparable period, they reported a headline loss per share of -91 cents. For this period, they expect a deterioration to an even uglier loss of between -R1.32 and -R1.37.
The share price is R1.30 (after falling 6.5% on the day), so this puts ArcelorMittal on a P/E of -1x. That’s something you won’t see very often.
Here’s the thing that might really surprise you though: the share price is up 48% over 12 months! Why? Because the market is hoping that the IDC will rescue this thing with some kind of transaction that creates value for shareholders.
Ghost Bites: Hope isn’t a strategy in business. It shouldn’t be a strategy in investing, either.
Glencore is on track for full year production, but the second half will be critical (JSE: GLN)
All but one of the underlying commodities is weighted towards H2 production
Based on a production report for the first six months of the year, Glencore feels like the company is on track to meet guidance for copper, zinc and nickel.
The nuance here is that this is despite the sale of a copper and zinc mine, so the rest of the copper and zinc mines are actually running ahead of guidance. There are small adjustments to the mid-points of guidance for energy (1Mt up) and steelmaking coal (1Mt down).
Being in line with guidance doesn’t tell you anything about the direction of travel. It merely tells you that the mines are performing in line with management expectations. You can easily see this by scanning the table dealing with year-on-year production movements, including moves like +15% in copper and -46% in cobalt.
Like all mining groups, Glencore has to manage numerous potential sources of volatility. It’s not just about the grade of the ore, either. In the the DRC for example, there’s a cobalt export quota regime that is hurting operations. Another interesting element in this period was the voluntary production curtailment of energy coal at Cerrejón in response to market conditions.
With so many risks to manage, the market would love to see a situation in which production is weighted towards the first half and thus already in the bank. Alas, zinc is the only commodity with a tilt towards production in the first half (51% vs. 49% in H2). Steelmaking coal is sitting at a 44% – 56% split. Copper, the metal that everyone cares the most about, is 47% – 53%.
Ghost Bite: There’s all to play for in the second half. The share price is up 27% year-to-date, with the market paying plenty of attention to any mining house with a meaningful copper position.
Shaftesbury Capital’s London West End strategy keeps paying off (JSE: SHC)
A differentiated strategy can be so powerful – including in property
Shaftesbury’s results for the six months to June 2026 enjoyed ongoing strength in the London West End portfolio. As they say: location, location, location!
In fact, this portfolio is a great example of what real-life Monopoly would look like:
New leases achieved rentals that were 18% ahead of the previous passing rents. The fund’s overall rental base increased by 3.8% on a like-for-like basis, while the portfolio valuation moved 3.4% higher on a similar basis.
Earning were up by 8%, but the bigger highlight is that the interim dividend increased by a delightful 16% to 2.2 pence per share. This is quite the growth rate for a fund that operates in hard currency!
The fund recycled capital via disposals of £64.7 million and acquisitions of £31.2 million. The loan-to-value is all the way down at 16.1%, so this balance sheet has plenty of firepower. As a reminder of how different the interest rates can be across developed vs. emerging markets, Shaftesbury’s weighted average cost of debt is 3.9%.
Ghost Bite: Despite this solid underlying performance, the share price is only flat year-to-date. It’s been on quite the adventure though, as sentiment soured when conflict broke out in Iran:
Valterra Platinum just banked the third highest interim profit in company history (JSE: VAL)
The PGM sector played ball in the first half of 2026
Valterra Platinum has shown us exactly what it looks like when the PGM sector shines. For the six months to June 2026, revenue jumped by a delicious 93%. Adjusted EBITDA came in 5x higher, with a spectacular 406% jump.
Mining EBITDA margin more than doubled, up from 22% to 50%.
It gets even crazier at HEPS level, where we’ve seen a move from R4.73 to R82.02. In case you’re wondering, that’s a 1,634% increase!
Naturally, with profits like these, there are strong free cash flows. The group has swung from negative free cash flow of -R4.6 billion to positive R25.5 billion. Lovely. This has improved the health of the balance sheet dramatically, with a net cash position of R23.7 billion vs. net debt of R4.9 billion in the comparable period.
And then the chef’s kiss: a 2,920% increase in the dividends for the year.
This is the part where I remind you of the flooding at Amandelbult in February 2025. This gave them an exceptionally soft base for comparison, although a 66% increase in the rand PGM basket price means that much of this growth is the real deal.
Production guidance has been reaffirmed for the full year. Management is doing what they can to make money, with the prevailing PGM prices needing to do the rest.
Ghost Bite: This is the third highest interim profit in the company’s history. When the money flows in PGMs, it’s a torrential downpour. Usually followed by a multi-year drought.
Results of previous poll:
Nibbles:
Greencoat Renewables (JSE: GRP) has given the market an update on its net asset value and recent capital allocation. The company has a stated aim of allocating €100 million to buybacks. They’ve announced a €50 million buyback programme, with the initial €25 million already deployed and funded organically. Looking at the underlying performance, portfolio production was 6% below budget for the first half of the year, but at least they had a much better Q2 vs. Q1. Investors will hope that this momentum will continue! Overall, the net asset value per share has dipped by 2.3 cents to 97.2 cents, with lower long-term German power prices as the major drag on performance. The target for the full year dividend has been maintained.
Putprop (JSE: PPR) is currently preparing a complicated circular that deals with multiple transactions. This includes the disposal of the Mamelodi Square Enterprise and the Dobsonville Property, as well as the acquisition of the Kramerville Letting Enterprise. To avoid having multiple circulars, they are bundling everything into a single Category 1 transaction. Given the associated administrative burden, they aren’t managing to get this done within 60 days from the associated terms announcements. The JSE has granted an extension permitting the circular to be distributed by no later than Friday, 21 August.
Canal+: counting their chickens way too early on MultiChoice
Kumba Iron Ore’s dividend has more than halved
Merafe’s HEPS caught many by surprise
Mpact is having a tough time (yes, again)
Vodacom: pyramids and profits
Boxer fights in the deflationary ring (JSE: BOX)
And it ain’t easy
With the local retail sector under tons of pressure, Boxer is seen as one of the better fighters to pick. They have a focused business model and an appealing growth runway, as lower-LSM shoppers in South Africa continue to transition from informal to formal retail.
But even at Boxer, things aren’t easy at the moment.
For the 20 weeks to 19 July 2026, it’s interesting to note that Boxer’s basket experienced price deflation. That’s just as well, as the transport costs to get to the shops went through the roof!
The deflation has been driven by key commodities like maizemeal, rice and flour. As Boxer’s business is built around selling staples rather than discretionary foods, they get hit hard by soft commodity deflation like this.
Normal supply and demand rules tell us that volumes should increase when prices come down. That’s true in theory, but (1) consumers are getting smashed elsewhere in their budgets and (2) there’s only so much demand for something like rice.
With deflation at -1.9% (vs. -1.6% in FY26 and -0.7% in H1’26), Boxer managed like-for-like turnover growth of 2.2%. That’s significantly lower than the 3.7% like-for-like growth in H2’26, so investors will keep a close eye on momentum here.
The thing that Boxer didn’t mention in the SENS is that like-for-like sales in the 17 weeks ended 29 June 2025 (a reasonable comparable period) was 3.9%, so there’s been a slowdown throughout FY26 and now into FY27.
The store footprint is expanding, so Boxer’s overall turnover growth was 7.2%. This means that 500 basis points came from new stores, as 220 basis points was from like-for-like growth. The company believes that it is on track to meet the previously communicated FY27 store rollout plans.
They also think that trading profit margin is going to be similar in H1’27 vs. H1’26. That’s good going when you consider the modest like-for-like growth in the context of inflationary pressures like energy, security and municipal rates.
The silver lining for Boxer is a dark cloud for the consumer: selling price inflation is expected to increase in the second half of the year. If fuel prices also come back down to earth, my view is that sales growth should look better in the latter part of 2026.
Ghost Bite: Boxer is one of the best retail stories in South Africa. If it’s tough for them, imagine what it’s like for less successful players?
Canal+: counting their chickens way too early on MultiChoice (JSE: CNP)
The FIFA World Cup period is no indication of sustainable performance
According to Canal+, the MultiChoice turnaround plan is underway. They were very excited to announce that June 2026 saw the best subscriber acquisition month in South Africa in over a decade.
Of course, this was entirely because of specials linked to the FIFA World Cup – a hugely popular tournament even when South Africa isn’t playing. Add in the way Bafana Bafana performed and it’s not hard to figure out that the “turnaround” is really just a lucky break in terms of the timing of a major sports event. I suspect that Canal+ is about to learn a hard lesson about how South Africans manage their budgets. The post-tournament cancellations must be epic.
Interestingly, if you strip out MultiChoice, then the rest of Canal+ has only been a modest performer in terms of revenue. Like-for-like revenue excluding MultiChoice was 1.4% for the six months to June 2026. But here’s the impressive thing: adjusted EBIT excluding MultiChoice was up 13%, so they are doing a good job on margins.
In Africa & Asia, the segment that includes MultiChoice, you’ll find a growth rate of 1.3% if you adjust for the timing of the acquisition. In other words, this growth rate gives a proper view of how MultiChoice is performing.
I’m going to frame that differently: in a period with the most important sports event in the entire world, revenue was up by less than inflation. I understand the unit economics and the significant value of adding new subscribers, but that’s still a concern.
As for the rest of Canal+, which is now available to investors on the JSE, I’m very impressed with the margin story.
Ghost Bite: Perhaps I’m just tainted by my user experience when I still suffered through being a DStv streaming customer, but I remain bearish on MultiChoice. Instead of paying R699 per month for that frustration, I have an F1 TV Pro subscription and I watch the rugby at my local watering hole. There are at least two benefits here: the beer is crisp and I don’t have to use the app.
Kumba Iron Ore’s dividend has more than halved (JSE: KIO)
And it’s not even management’s fault!
Having given us a production update just a few days ago, Kumba Iron Ore has now released results for the six months ended June 2026.
We already knew that production would be down slightly based on pressure at Kolomela. We also knew about sales volumes dipping by 1% due to planned maintenance by Transnet. But now we also know that revenue fell by 11%, driven by a 1% decrease in the US dollar price and significant rand strength.
Remember: a strong rand is hard for exporters. Our mining sector relies on exports.
Due to the level of operating leverage inherent in mining business models (i.e. the prevalence of fixed costs), this decrease in revenue means that EBITDA margin contracted by a nasty 11 percentage points (from 46% to 35%). EBITDA dropped by 32% and HEPS fell by 41%!
As for the dividend per share, that’s down by 52%.
I’m going to remind you that this is almost entirely due to changes in the rand / dollar exchange rate. Such is the risk in the mining sector: cash returns can halve due to factors completely outside of management’s control.
Capex increased by 36% in this period, giving us a great reminder of the bravery required when allocating capital in this sector. You need a strong stomach to ramp capex by this kind of percentage in a period where the dividend has halved.
In terms of full year 2026 guidance, investors will be relieved to learn that they expect to meet production guidance. They also expect to be in line with cost guidance at Kolomela and Sishen. There’s little else that management can do, with the overall returns largely in the hands of international pricing and the way the rand moves.
Ghost Bite: Here’s a share price chart to remind you what a cyclical stock looks like. Spoiler alert: it’s not a buy-and-hold strategy:
Merafe’s HEPS caught many by surprise (JSE: MRF)
There’s more to Merafe than just ferrochrome
Merafe closed nearly 5% higher on the day of the release of a production report dealing with a period that was filled with production challenges.
In the six months to June 2026, production was down for chrome ore and PGM concentrates. Attributable ferrochrome production was the worst of course, with a precipitous decline from 112kt to 28kt in the six months to June 2026. If you don’t have electricity at an affordable rate for your smelters, you can’t produce ferrochrome.
Despite this, HEPS is expected to increase by between 55% and 75% for the period. How is that possible?
The company attributes this to higher commodity prices and volumes sold over the period. Either way, when results come out on 11 August, they are going to make for interesting reading.
Ghost Bite: The relief from Eskom in the form of a special tariff couldn’t have come a moment too soon for this sector. Things were looking desperate!
Mpact is having a tough time (yes, again) (JSE: MPT)
The impact of leverage is clearly visible here
Spare a thought for Mpact investors. A trading statement for the six months to June 2026 has revealed an expected decrease of between 57.3% and 47.8% in underlying EPS from continuing obligations.
This was driven by a decrease in EBITDA of just 4%, so that shows you just how much leverage sits in this business.
This modest dip in EBITDA turns into a much bigger problem by the bottom of the income statement thanks to higher depreciation and a 13% increase in net finance costs. In both cases, this is directly linked to the completion of the Mkhondo upgrade project.
The nuance is that net debt actually fell from R3.0 billion to R2.6 billion. In other words, the increase in net finance costs is because they can no longer capitalise interest to the Mkhondo project, rather than because debt is running away from them. That’s not much of a silver lining on a day when the stock dropped by 5%, but it’s something at least.
As for the pressure on EBITDA, the company makes it clear that the conflict in Iran did them no favours, with a combination of higher input costs and lower demand as businesses cut back. The agricultural sector, a key customer of Mpact, also struggled with adverse weather conditions.
Performance tends to be weighted towards the second half of the year, so a crummy first half is definitely preferred to a poor second half. The big question is whether the second half will actually be any better!
Ghost Bite: It always feels like Mpact is forced to play life on hard mode. This is one of the many examples of the broader deindustrialisation of South Africa and how tough it is.
Vodacom: pyramids and profits (JSE: VOD)
The investment in Egypt is working out very nicely for them
Vodacom is firmly an Egyptian story at the moment. After my travels to the desert earlier this year, I can confirm that the average Egyptian has two settings: using their car hooter, or using their phone. Often simultaneously.
In an update for the quarter ended June 2026, Vodacom confirmed that they grew Egyptian service revenue by 32.8% in local currency. Reported revenue grew by 18.7%, so the currency translation didn’t fully ruin the party. Compared to just 2.0% growth in South Africa, it’s clear where the relative growth engine is.
The other segment that must be mentioned is Vodacom International, with normalised growth of 12.1% and reported growth of just 2.3%. Vodacom completed the acquisition of a controlling stake in Safaricom at the end of June, moving from a shareholding of 35% to 55%.
Fibre remains an important investment area in an otherwise mature South African market, which is why Vodacom invested a further R800 million into Maziv to support the completion of the Herotel transaction. It also sounds like things are improving in the prepaid side of the business in South Africa.
Importantly, the medium-term targets for EBITDA and operating free cash flow have been upgraded from double-digits to early-teens growth. This is deliberately vague, but it’s a direction of travel that investors will appreciate. I still have several years to go before I can confirm this, but I’ve heard that early-teens growth is more fun than early-teens children!
Ghost Bite: The share price closed 2.4% higher on the day. The total return over 12 months is around 18%, so Vodacom has been a good play recently.
Nibbles:
Director dealings:
The CEO of Marshall Monteagle (JSE: MMP) bought shares in the company worth R219k.
enX (JSE: ENX) has released the circular dealing with the proposed disposal of the power solutions business to a subsidiary of Generac Holdings. This deal is a result of the magical disappearance of load shedding literally ruining the power backup industry, leading to a heavily overstocked position for companies that tried to play in that space. Generac is still seeing value though, with a deal price of R220 million on the table. Cash will only flow over time, with a further complexity being the management incentive arrangement that needs to be settled as well. If you want to dig into the detail, you’ll find the circular here.
Impala Platinum (JSE: IMP) has flagged recent serious incidents at the Impala Rustenburg complex, with the decision taken to suspend operations from 24 until 28 July. This includes a number of targeted interventions around safety. Naturally, this is going to have an impact on production for the year ending June 2027. An update on this will come in due course.
If you’re interested in learning more about ASP Isotopes (JSE: ISO), then be aware that the company is hosting a capital markets day in London on September 8th. Detailed presentations will no doubt be made available.
Kore Potash (JSE: KP2) announced its review of operations for the quarter ended June 2026. They’ve been highly focused on advancing the formal sale process for the company. Two parties were initially interested in buying the group. One of them has already walked away, while the other is in a due diligence exercise. A further party emerged in early June and is currently taking a detailed look as well. The thing that concerns me is that Kore Potash has been finalising the terms of a funding package with OWI-RAMS GmbH for over a year now. Those term sheets were signed in June 2025! The share price may be up 35% over 12 months, but we’ve already seen a sharp correction from the 52-week high of 100 cents to the current level of 73 cents. How much patience does the market really have?
Harmony Gold (JSE: HAR) has concluded three new loan facilities as part of refinancing existing facilities. There’s a mix of ZAR- and AUD-denominated structures, with both revolving credit facilities and term loans in play. The loans are sustainability-linked, which means they reward Harmony to achieving specific ESG-linked targets. The pricing swings by 5 basis points either way depending on whether the targets are hit or missed.
Anglo American (JSE: AGL) announced that the Quellaveco copper mine in Peru and the three copper operations in Chile (including Los Bronces) have been awarded The Copper Mark for responsible copper production. This makes a difference when dealing with multiple stakeholders.
PSG Financial Services (JSE: KST) announced that Global Credit Ratings (GCR) affirmed the national long-scale and short-term issuer rating at AA-(ZA) and A1+(ZA) respectively, with a stable outlook. This is being informed by the company’s assets under management (AUM) growth and underlying performance.
Cornél Lodewyks, managing executive of Lancewood, has been promoted to COO at Libstar (JSE: LBR). It’s always good to see promotions from operating subsidiaries up to group level.
Mustek’s (JSE: MST) financial year-end will change to March 2027 to align with Novus Holdings (JSE: NVS) as the new controlling shareholder.
Nutun (JSE: NTU) announced that Hans Zachar is the new CEO of Nutun International and co-CEO of the group, replacing Ruben Moggee in that role. Moggee will transition from an executive to non-executive director role. Zachar has been with the group since 2023 and has driven the AI and digitisation strategy, a clear focus area for the group. Notably, Roberto Rossi is stepping down from the board of the company that he co-founded.
MC Mining (JSE: MCZ) announced that Christine He has resigned as CEO of the company. She will be replaced by Albert Deng (the current chairman) as interim CEO. Much was achieved during He’s time as CEO, including the commissioning of the Makhado hard coking coal project and the transaction to bring Kinetic Development Group in as the new controlling shareholder of the group.
If you are a shareholder in Acsion (JSE: ACS), then be aware that the company has announced the terms of its scrip distribution alternative. If you wanted to, you could be paid your dividend in the form of shares instead of cash.
African Rainbow Minerals to invest heavily in two South African projects
Anglo American needs a strong second half in copper
Cashbuild’s volumes aren’t telling an encouraging story
Fairvest gets ready to gear up its fiber investment – literally
Kumba’s full-year guidance is unchanged despite a dip in H1
Mr Price: alarm bells are ringing for South African consumers
Pepkor’s FintechCo would be a big listed company in its own right – in theory, at least
Sirius acquires another defence-themed business park in Germany
African Rainbow Minerals to invest heavily in two South African projects (JSE: ARM)
Mining requires bravery when it comes to multi-year capex
African Rainbow Minerals has approved the Bokoni Platinum Mines project that comes with an estimated capex bill of R15.2 billion. That’s quite the show of faith in both this mine and the broader PGM story!
This comes after the completion of the Definitive Feasibility Study in June 2026. The idea is to achieve production of 180 thousand tonnes per month (ktpm), comprising 60ktpm from the existing concentrator and 120ktpm from a new concentrator.
The refurbished existing concentrator is expected to be commissioned in the first half of the 2028 financial year. The new concentrator will only be commissioned in the second half of 2030. Steady state across the project is expected to be reached in 2032.
The expected internal rate of return is 28%. Although this will ultimately depend on PGM prices, that’s an encouraging return that has some margin for error. It also helps that the capex bill will be spread over 7 years and that the refurbished concentrator will be a positive contributor to cash flows while the new concentrator is built. If you’ve ever built a cash flow model, you’ll know how important the timing of cash flows is.
African Rainbow Minerals believes that the project can be funded mainly by existing cash resources and profits generated over time, with external debt funding “to the extent required”.
The company has also approved the recommencement of open-pit mining and nickel concentrate production at Nkomati Nickel Mine. This is a far more modest capex bill (only R753 million) with an expected IRR of 28.36%. It’s interesting to note the similar percentage returns of these two projects.
Ghost Bite: Mining requires brave application of capex. Despite the share price having lost 21% of its value over 12 months (and now trading close to 52-week lows), the company needs to commit to through-the-cycle investment.
Anglo American needs a strong second half in copper (JSE: AGL)
This is the metal that everyone is talking about
Anglo American has released a production report for the quarter ended June 2026. Before I carry on, please note that there’s a similar update on Kumba Iron Ore (JSE: KIO), a subsidiary of Anglo American, further down in Ghost Bites.
As you’re probably expecting, copper is still the belle of the ball in the mining sector. With Anglo expecting the copper-driven merger with Teck to be completed by March 2027, this is the commodity that everyone is watching.
Anglo delivered increased copper production at Collahuasi and Quellaveco on a quarter-on-quarter basis. The restart of the second plant at Los Bronces was also a positive contributor. But if you look on a year-on-year basis, copper production is perfectly flat. Guidance for 2026 is unchanged and weighted towards the second half, so there’s significant execution risk that Anglo will need to make sure they manage.
In iron ore, Anglo describes Kumba as a “stable” performance (probably a fair take). The same language is applied to Minas-Rio. Although premium iron ore production increased by 1% quarter-on-quarter, the year-on-year number is a decrease of 3%. Production guidance is unchanged for the year, while sales at Kumba will depend significantly on Transnet’s performance.
In manganese ore, production was up 20% quarter-on-quarter and 22% year-on-year. The previous year was impacted by the knock-on effects of a tropical cyclone in March 2024.
That takes us to the end of the list of commodities that Anglo plans to keep. We now move into the businesses they are getting out of as part of the broader corporate simplification.
In May, they agreed to sell their Steelmaking Coal business in Australia to Dhilmar for up to $3.875 billion in cash. They expect to complete this deal by the first quarter of 2027. Steelmaking coal production jumped by 32% quarter-on-quarter, but was down 1% year-on-year.
As for De Beers, I’ve seen a number of news headlines that Anglo is looking to sell to a consortium led by Gareth Penny, an ex-CEO of De Beers. Diamonds being bought by a Penny is nominative determinism of the highest order – I don’t think Anglo will get much for it.
Diamond production increased by 9% quarter-on-quarter and 88% year-on-year. Although Anglo’s official line is that this is due to the timing of maintenance and the grade of ore being mined, you’ll have to forgive my cynicism here. When your premium pricing model is dying (H1 prices fell 32%), you need to ramp up the volumes. Production guidance for the full year is unchanged.
Finally, we deal with the nickel business. Anglo has agreed to sell this to MMG Singapore Resources, with the deal currently going through European competition approval processes. Production dipped 4% quarter-on-quarter and 6% year-on-year.
Ghost Bite: Anglo’s share price has jumped more than 50% over 12 months. You can thank copper for this.
Cashbuild’s volumes aren’t telling an encouraging story (JSE: CSB)
South African consumers aren’t spending on their properties
Cashbuild, a local company in which I have a stake that I should’ve sold, has released a voluntary fourth quarter update.
Although revenue was up 6% for the quarter, the existing stores (defined as stores before July 2024) only managed 1% growth. The new stores contributed 5% to growth. This isn’t a particularly encouraging outcome in terms of the underlying strength of the business.
The quarterly growth is consistent with the full financial year, which also grew by 6%.
Another lens you can use at Cashbuild is comparable store revenue, which excludes the impact of mergers and acquisitions and store closures. With this approach, you’ll find growth of 3% for both Q4 and the financial year as well.
Inflation was light, coming in at just 1.5% at the end of June 2026 vs. June 2025. Existing stores suffered a decline in volumes. That’s concerning during a period of modest inflation and supposedly improving sentiment in South Africa. Thank goodness the SARB didn’t increase rates last week!
Cashbuild has been an unfortunate story where I absolutely should’ve taken profit at the end of 2024 thanks to the GNU exuberance. I thought I would stick to my knitting and hold it as a play on SA Inc and things getting better here. Well, the joke is on me, with the share price now at R117 vs. the late 2024 peak of over R227. If you’re keen to see that chart, I covered it in this YouTube video (from around the 2:20 mark).
Ghost Bite: Buy-and-hold isn’t always the smart idea that people would like you to believe. I am much better at buying market weakness than I am at selling market exuberance.
Fairvest gets ready to gear up its fiber investment – literally (JSE: FTA)
They are serious about the township fiber opportunity
Fairvest is more than just a traditional property company. The group has an unusual investment in the form of Onepath Investments, a fiber infrastructure company. To help the market understand more about this opportunity, Fairvest delivered an investor presentation focusing exclusively on Onepath.
Onepath is the “landlord” in this situation, with fibertime as the tenant. There’s a separate company (Refiber Digital Infrastructure) that acts as the capital and asset manager. By using this clever analogy, Fairvest lands the point that owning fiber network infrastructure might not be such a big strategic departure from owning property.
Of course, the real play here is to achieve connectivity for township users, as Fairvest holds a number of township-adjacent malls. Having additional data on the users in these areas could help them make better property investments.
My understanding is that fibertime’s model is based on a cost of R5 a day and a true pay-as-you-go model. In FY25, they had 285k users. By FY27, they are targeting 3.05 million users! This works out to an average of 3.3 users per home by FY27.
To achieve this, cumulative capex by FY27 would be R4.8 billion. The longer-term goal (2030) is to have 20 million users and 5 million homes, delivered with cumulative capex of R24.3 billion. As growth stories go, that’s an exciting one.
If you can believe it, the technology partner is Nokia. I’m surprised to see in one of the pictures in the presentation that the routers need battery backups. We all know that there are still 3310 owners out there who haven’t charged their phones since 2002!
The net yield on capital deployed is sitting at at 15.1% on an ungeared basis. Admittedly, this is a different risk profile to traditional property ownership (retail malls etc. yield high single digits). Still, this seems like a really attractive return. Perhaps most importantly, it’s high enough to easily be able to service any related debt. Fairvest plans to introduce gearing in the coming months.
Ghost Bite: REITs are yield-focused companies. When you’re getting mid-teens on an ungeared basis, the introduction of gearing can leverage this up to really juicy geared yields (as the cost of debt is way below the ungeared yield). This could be one to watch!
Kumba’s full-year guidance is unchanged despite a dip in H1 (JSE: KIO)
This is one of the toughest business models in the country
Kumba Iron Ore released a production and sales report for the six months to 30 June 2026. This gives investors important clues about the interim financial performance and how the company is tracking against full-year targets.
It’s unfortunate that production was down by 3% year-on-year thanks to a 16% drop at Kolomela. Although Sishen is a much larger mine, a 3% increase at that mine still wasn’t enough to offset the downward pressure at Kolomela. This directly impacts the level of on-mine stock, which has decreased from 5.7 Mt in December 2025 to 4.8 Mt at the end of June 2026.
Sales volumes fell by 1% during a period that included planned maintenance by Transnet. Cleverly, Kumba planned maintenance at its own mines to coincide with the Transnet shutdown. Transnet’s ability to achieve export throughput on behalf of the mines is the fact that impacts stock held at Saldanha Bay Port, which increased from 1.8 Mt to 2.2 Mt.
Despite the pressure in H1, the company feels good about still delivering full-year production and sales guidance. This tells you a lot about the resilience that gets baked into their annual guidance!
Cost guidance has been let unchanged for Sishen and Kolomela, but the company has noted upward inflationary pressures. This is pushing costs towards the upper end of the range at Sishen and the middle of the range at Kolomela.
Separately, Kumba announced a 20-year energy offtake agreement with Envusa Energy for the on-site supply of electricity to Sishen. Envusa Energy is a joint venture between EDF Power Solutions and Anglo American (JSE: AGL), Kumba’s controlling shareholder. Together with existing projects, this will take Kumba’s renewable energy penetration to around 45%.
Ghost Bite: This is a very hard business to run. Before we even consider the volatility of commodity prices, Kumba also needs to navigate infrastructure challenges just to get the stuff to port. Kumba’s total return is -6% over 12 months, -26% over 3 years and -36% over 5 years. Ouch.
Mr Price: alarm bells are ringing for South African consumers (JSE: MRP)
There are a number of worrying signs here
Mr Price has given the market a voluntary trading update for the 13 weeks ended 27 June 2026. Group sales were up 45.3%, but that’s obviously because of the recent acquisitive activity at NKD. Believe me, if Mr Price was growing at that rate organically, money would be falling out of the sky in South Africa. As we learnt in Cashbuild further up, that’s certainly not the case.
So, the first thing we need to do is strip out NKD, which then gives us growth of 3.2%. That’s more in line with what we would expect to see. It’s still a decent outcome, ahead of Mr Price’s quoted market growth of 0.8%. This implies that they’ve been winning market share.
But then we get to the bad news – comparable store sales were flat. This tells us that all the growth came from new stores in South Africa. The store footprint increased by a net 32 stores, with trading space up 3.8% on an annual weighted basis. That’s better than no growth at all, but it paints a worrying picture for the South African consumer.
Another indication that all isn’t well is that online sales were up 4.7%, while total store sales were up 3.1%. Mr Price puts minimal emphasis on online sales, as they focus more on being a bricks-and-mortar business. To see online outperforming store sales is a surprise.
Mr Price’s focus is on cash sales, which seem to be hard to get right now. Cash sales were up 3.1% and credit sales were up 3.8%. This is another indication of a struggling local consumer.
Looking at product categories, Homeware is another flashing red alarm for South African consumers. Growth was just 0.7%, with comparable sales down 3.3% and volumes up just 0.2%. Yuppiechef was the star of the show as usual, with double-digit sales growth and improved gross margin. The wealthy still have money here, but nobody else seems to.
Apparel, the anchor of the group with a 78.8% contribution, grew by 3.4%. Comparable store sales increased by 0.6%, so at least they were positive here.
Telecoms, the smallest contributor at just 3.9%, grew by 11.2% – this is becoming a more important area over time.
On the plus side, the group protected gross margin over this period, with margin up 40bps during a time in which competitors were highly promotional. South Africa is described as having a clean inventory position, which implies that gross margins aren’t under immediate threat.
Then we get to Europe, where NKD outperformed the relevant market benchmarks (the total apparel market and the value segment in Germany). 21 stores were closed and 23 opened, so there’s only a tiny increase in the footprint to 2,156 stores. NKD is also described as having a clean inventory position. This is about as much as Mr Price will tell us at the moment, so we need to wait for more detailed reports.
Ghost Bite: When value-focused fashion houses are struggling like this, while the top layer of South Africans continue to buy Yuppiechef like ice creams on a hot day, then you really have to ask hard questions about our interest rates. I’m very glad that the SARB didn’t hike.
Pepkor’s FintechCo would be a big listed company in its own right – in theory, at least (JSE: PPH)
As a shareholder, I like this deal
By now you know this news, but I’m including a note on Pepkor for the sake of completeness in this catch-up edition of Ghost Bites. It’s also worth reminding you that I bought shares in Pepkor a couple of months ago based on their underlying business and the upside optionality of the bank they are building. It’s a nice surprise to see even more momentum in the fintech business than I expected!
Pepkor is combining its Flash business with Shop2Shop to create “FintechCo”, a R21.3 billion business that Pepkor will have 57.1% in. This is calculated based on the value of Flash (R10.6 billion) and a cash subscription by Pepkor for new shares in FintechCo to the value of R1.57 billion.
As I pointed out on social media at the time of the deal, FintechCo would therefore be worth more than Truworths (JSE: TRU) or The Foschini Group (JSE: TFG). You have to be careful when comparing listed companies to what is essentially just a directors’ valuation, but the point is hopefully still made.
What will the new fintech do? The fintech ecosystem is about as complicated as things get, but effectively they will have extensive participation across the value chain linked to the informal market. This aligns beautifully with Pepkor’s value-focused strategy.
In terms of financials, we only have outdated full-year numbers to work with (September 2025 for Flash and June 2025 for Shop2Shop). The difference in growth rates is staggering though, with Shop2Shop having achieved a three-year revenue compound annual growth rate (CAGR) of 28% vs. 9% at Flash. In terms of profit after tax, Flash achieved R488 million and Shop2Shop was R385 million.
Aside from questions around the relative valuation, the market has also raised concerns around the conflict of interest in the deal. CEO Pieter Erasmus has a stake in Shop2Shop that predates his appointment at Pepkor. Although it’s not a related party deal under a technical application of the JSE rules, the company did the right thing by excluding Erasmus from all the deliberations at board level.
My view on this? Whilst conflicts of interest need to be carefully managed, I would be far more worried if this looked like an “odd” deal, or if a vast amount of cash was changing hands. In practice, this deal makes a world of sense for Pepkor through a strategic lens. It’s also a merger where most of the value is on paper rather than in cash, so that gives me further comfort.
Ghost Bite: There’s an intention to list FintechCo down the line, so there’s now another value unlock opportunity brewing inside Pepkor. As a shareholder, I like that. The share price is trading close to 52-week lows, so I’m very tempted to add to my current position.
Sirius acquires another defence-themed business park in Germany (JSE: SRE)
The execution of this strategy continues
Sirius Real Estate is certainly consistent when it comes to their acquisition strategy. They stick to assets in the UK and Germany, with the latter generally having a defence industry flavour.
The latest acquisition is a light-industrial business park in Fulda, north east of Frankfurt. They are paying €49.8 million for this asset based on an EPRA net initial yield of 7.8%.
The anchor tenant is a manufacturer of ballistic protection equipment. This is a good opportunity to remind you that these defence properties aren’t always highly specialised – it often comes down to other tenants in the area, or proximity to supply chains. As an analogy, think about how financial services firms tend to huddle together in a certain area.
The weighted average lease expiry is 5.1 years, so there doesn’t seem to be an immediate opportunity for Sirius to work some magic on the yield. Not everything they buy is a fixer-upper.
Ghost Bite: If you would like to understand the Sirius strategy in more detail, this podcast with the top execs at the end of 2025 is just as relevant today as it was then.
Nibbles:
Director dealings:
Unsurprisingly, various Datatec (JSE: DTC) directors used the scrip distribution alternative as a way to get their hands on a further R103 million worth of shares. This is an opportune time to remind you that the CEO still has a huge stake in the company that he founded.
The CFO of Lewis Group (JSE: LEW) has sold shares worth over R3.1 million. Although this sale is to “rebalance his portfolio”, a sale is a sale.
A director of Santova (JSE: SNV) sold shares worth R400k.
A director of Trematon (JSE: TMT) bought shares worth R82.7k.
A non-executive director of Finbond (JSE: FGL) bought shares worth R32k.
A few Hudaco (JSE: HDC) directors received shares based on the automatic exercise of share options. If my understanding is correct, there was also one director who chose to exercise the options and then sold the entire amount for R23.5k.
Thanks to the company’s previous announcement about the underlying fund, we already knew that Reinet (JSE: RNI) wouldn’t be telling an exciting story around NAV growth in the latest quarter. We now have the numbers for the holding company, which confirm that NAV per share increased by just 1% over the past three months. This was thanks to share buybacks. For a more detailed look at Reinet, you can check out what I wrote when they gave the update on the underlying fund.
Vukile Property Fund (JSE: VKE) announced that Global Credit Ratings (GCR) has affirmed its credit ratings with a stable outlook. This is very important for a REIT, as obtaining well-priced debt is a key factor in achieving solid shareholder returns. The company also announced that Dr Renosi Mokate will step down as Lead Independent Director in September, to be replaced by James Formby. As a final update on Vukile, the company is also busy with a debt capital markets roadshow – a critical source of finance for property funds. The presentation for the roadshow is a helpful overview of the group.
The final step in the succession plan at Dis-Chem (JSE: DCP) is upon us. After founding the business five decades ago, Ivan Saltzman is now retiring from the board with immediate effect. This is hot on the heels of the news of his son, Saul Saltzman, also resigning from the board. I can’t help but wonder if this decision was accelerated by the recent bad press around certain social media posts made by a different member of the Saltzman family. Companies with strong ties to its founders can be vulnerable to the “social outrage” that is a feature of the modern world. Either way, after 48 years with the company, Saltzman Senior has certainly earned his retirement.
NEPI Rockcastle (JSE: NRP) has announced that they will host a capital markets day on 21 October 2026. This is well worth diarising, as the day will provide deep insights into both the portfolio and the broader property market in the Central and Eastern European region.
If you are invested in ASP Isotopes (JSE: ISO) and you want to understand more about the helium assets in the group and the planned deal with Noble Africa, then the company has made the transcript available from the recent investor day.
Mustek (JSE: MST) announced that Rectron, a wholly-owned subsidiary of the group, has suffered a cybersecurity attack. They became aware of it on 15 July and immediately followed the process around incident response and business continuity. As this stage, they haven’t given any indication of the scope and extent of the incident.
I’m not terribly surprised that Sappi (JSE: SAP) shareholders voted strongly in favour of the proposed joint venture between Sappi and UPM in Europe. Only 1.42% of votes were cast against this transaction. I genuinely cannot imagine why anyone would vote against it, as it’s not like Sappi as many other great options available right now. We are talking about a share price that has lost 55% of its value this year!
Shuka Minerals (JSE: SKA) announced that it has raised gross proceeds of £750k through a subscription for new shares at 4 pence per share – a 53.9% premium to the closing price on 21 July. The subscriber is Menel Energy and Resources, a company that has various mining projects in Zambia. The first tranche of £375k has already been received, with the second tranche expected to be received by 31 August 2026. A warrant will be granted to Menel to subscribe for up to 18.75 million new shares at 8 pence per share, exercisable until 8 July 2029. Remember, the longer the time period of an option, the more valuable it becomes. Separately, the company announced that it will issue 375,000 new ordinary shares at 4 pence per share in lieu of accrued fees owed to a former director.
Those keeping an eye on the share register at Labat Africa (JSE: LAB) will be interested to know that Muziwakhe Ibrahim Ndhlovu now has 28.41% of the shares in the company. This is related to the recent acquisitive activity at Labat.
Insimbi Industrial (JSE: ISB) has added some strong investment banking skills to its board with the appointment of Dean Crommelin as an independent non-executive director. It’s always interesting when small caps make appointments like these.
After a very rocky road, Kibo Energy (JSE: KBO) has found itself without a market for its shares. The listing on the AIM in London will be cancelled with effect on 27 July, as the company has failed to implement a reverse takeover transaction. The listing on the JSE is currently suspended. With the primary listing being cancelled, it’s hard to see how the JSE listing won’t follow suit. This leaves shareholders without any way to trade their shares publicly, although they do still own their shares in the company. If Kibo ever manages to put together a deal, shareholders may still get something out of this. But there’s also a good chance that it all just fades away.
The Starbucks disaster in South Korea cost a CEO his job, a brand its market, and thousands of customers their loyalty. The strangest part isn’t that somebody made the mistake; it’s that so many people didn’t catch it before it went public.
When I’m not scouring the internet for the weird and wonderful stories that I write in Ghost Mail every week, I make my living writing content for marketing agencies. This means that every once in a while, I write a line of copy that a client doesn’t like. It happens. I’ll get a note indicating where improvement is required, I’ll make the change and we’ll all get on with our lives. The whole process is usually seamless, professional, and unemotional.
Occasionally, the things I write in the marketing space will inspire people to take a particular action, or to buy a particular thing. Sometimes it makes them reflect, or even laugh. One thing my writing has never done, however, is enrage people to the point that they feel compelled to destroy the very products that I am trying to market.
I’m lucky in that way. As for the marketing team behind Starbucks in South Korea… well, they’ve been having a slightly harder time recently.
It started with a cup
On 18 May this year, Starbucks South Korea ran a promotion called “Tank Day”, built around their line of stainless steel mugs, dubbed “Tank Tumblers” for their size and capacity. It was part of a broader campaign highlighting the full tumbler range between 15 and 26 May.
What the marketing team appears to have missed is that 18 May is the anniversary of the 1980 Gwangju Massacre. On that date, the military junta killed hundreds of students at a pro-democracy protest using helicopters and – you guessed it – tanks.
That alone seems bad enough. But then the copywriting somehow made it worse.
Promotional material for the tumbler included the Korean phrase “whack on the table!” – unfortunately echoing a statement given by South Korean police in 1987 after a student activist died in custody. The claim was that he died of shock when an officer “whacked on the table” during interrogation. It later emerged that the student had been tortured to death. That scandal helped galvanise the mass protests that ended the military dictatorship and restored direct presidential elections later that year.
It’s a messy, traumatising story that sits at the centre of South Korea’s journey to democracy, much like the Soweto uprising of 1976 does in our own. It’s not the kind of thing people forget easily, which makes it almost unfathomable that nobody on the Starbucks marketing team paused at the sight of “Tank Day”, “18 May” and “whack on the table!” in a single campaign.
The marketing team may have been suffering from some kind of communal amnesia. The South Korean public they were advertising to was not.
Viral in the worst way
As you can imagine, none of this was received well. Protests sprang up outside Starbucks shops, where customers smashed branded cups and mugs with hammers while content creators streamed the spectacle. A boycott was called, and card payment volumesplunged 26% in a week. Fans deleted their loyalty apps and began demanding refunds from an estimated 400bn won ($260m) sitting on Starbucks prepaid cards. Government ministries cut ties, and even President Lee Jae Myung weighed in, calling out the brand’s “inhumane and disgraceful conduct”.
It’s a particularly hard blow for a brand that has spent almost three decades building itself into a premium, highly aspirational lifestyle fixture in South Korea. Reusable Starbucks cups (like the troublesome Tank) are a status symbol, and the cafés are popular places to work, study and socialise. Seoul has more than 300 locations – the highest concentration of Starbucks per capita in the world – and South Korea is the chain’s third largest market globally.
Initially, I thought the fact that Starbucks is an American brand might explain the faux pas. Maybe this was a campaign put together by an American marketing team, blissfully unaware of the connection between tanks and the 18th. But no – Starbucks doesn’t run its own stores in South Korea. It licenses the brand to Shinsegae, one of the country’s biggest retail conglomerates, which owns two thirds of the local operation through its E-Mart subsidiary. The people who created and signed off on this campaign were locals.
There are still a lot of unanswered questions about how exactly this happened. As someone who works in marketing, I can assure you that a campaign doesn’t go from one creator to storefronts nationwide with the click of a button; there are multiple checks and approvals along the way. I’m therefore as mystified by the multiple checkpoints this campaign got past as you are.
Two things we do know: Shinsegae Group says its marketers used generative AI to “help make suggestions” for the campaign, and some managers admitted to approving it without ever opening the email attachments showing the material.
The half-day apology
Starbucks South Korea may do their own marketing, but when it comes to crisis control, they apparently refer back to the American playbook.
First, they pulled the campaign and fired the CEO. Then, they suspended five other employees. The chairman of Shinsegae Group made a public apology on national TV, bowing three times to demonstrate his regret. So far, so logical – but then they did something unusual.
Starbucks announced it would close all 2,100 of its South Korean stores for half a day on 22 June so that staff could attend mandatory training. Employees reportedly received “education in historical awareness and social sensitivity through watching videos”. It was the first nationwide early closure since the chain opened in the country in 1999.
I can hear you asking, and I’m wondering too – why are baristas being trained to make up for the mistakes of the marketing team?
This is where the American strategy comes in. In 2018, Starbucks closed more than half its US stores for racial-bias training after staff called the police on two black customers waiting for a table. There, the training made sense: front-of-house made the mistake, so front-of-house got the training. In South Korea, the fix feels performative and out of touch. It’s the corporate equivalent of writing lines on a blackboard: highly visible, dutifully painful, and entirely disconnected from the failure it’s meant to address.
Everybody looked, nobody saw
Starbucks is unfortunately in good company here. The marketing faux pas is practically its own genre. Somewhere between the idea and the storefront, a room full of people looked at something and didn’t really see it.
Sometimes the failure is one of imagination. Bloomingdale’s ran a 2015 holiday catalogue ad showing a man leering at a laughing woman beside the words “Spike your best friend’s eggnog when they’re not looking”. That’s line presumably read as festive mischief in the room, and as a date-rape joke everywhere else.
Heineken’s 2018 “Sometimes, Lighter Is Better” spot slid a beer past three black people and into the hand of a white woman, which is the kind of glaring issue that only survives a storyboard review if nobody in the room is willing to say the obvious sentence out loud. Nivea managed something similar in 2017 with a deodorant ad captioned “White Is Purity”, which white supremacists adopted with such enthusiasm that the brand pulled it within hours.
Sometimes it’s a failure of memory. Adidasemailed Boston Marathon finishers in 2017 with the subject line “Congrats, you survived the Boston Marathon!” just four years after a bombing at that same finish line killed three people. Urban Outfitters sold a vintage Kent State sweatshirt in 2014, complete with red splatter marks and holes, 44 years after the National Guard shot dead four student protesters on that campus. Like the Starbucks South Korea debacle, these are cases where the reference wasn’t obscure. For some reason, nobody involved connected the words in front of them to the elephant in the room.
And sometimes the brand just doesn’t seem to understand (or respect) the market it’s selling to. Dolce & Gabbana’s 2018 “DG Loves China” campaign featured a Chinese model struggling to eat Italian food with chopsticks, complete with patronising voiceover. When the response was predictably furious, the brand’s Shanghai show was cancelled and their standing in China has never fully recovered. That same year H&M photographed a black child in a hoodie reading “Coolest Monkey in the Jungle”, which you might recall led to a slew of South African stores getting vandalised.
Attention is a scarce resource
None of these campaigns escaped into the world by accident. Bloomingdale’s, Nivea and H&M all have brand teams, legal teams and sign-off processes designed precisely to catch this sort of thing.
The problem is that approval and attention aren’t the same thing. A signature on a form means someone had the opportunity to look. It doesn’t mean that they actually did.
This is why the one near-miss in the pile is worth mentioning. In 2019, Nike designed a Fourth of July Air Max 1 with the 13-star Betsy Ross flag stitched onto the heel. The shoes had already gone out to retailers when Colin Kaepernick, then the face of the brand’s biggest campaign, phoned Nike to say that he and others found the flag offensive for its associations with the slavery era. Nike asked the stores to send the shoes back. The company took a beating for it – a state governor pulled tax incentives, senators announced boycotts, and the Anti-Defamation League went on record to say the flag isn’t a white supremacist symbol at all. You can argue about whether Nike made the right call. What you can’t argue with is the mechanism: somebody looked at the product, recognised something the room had missed, and picked up the phone.
The gap in attention that underpins all these stories is about to get much wider in every marketing department in the world, because we’re all being handed tools that make it easier than ever to make stuff. The machines will keep getting better at producing the work. So far, nobody is building a tool that gets better at reading it in context. If Starbucks is anything to go by, relying on AI suggestions isn’t the smartest approach to marketing.
About the author: Dominique Olivier
Dominique Olivier uses her love of storytelling and ideation to help brands solve problems.
Her first book, Lessons from Loss, has been published by Penguin Random House.
She is a weekly columnist in Ghost Mail and collaborates with The Finance Ghost on Ghost Mail Weekender, a Sunday publication designed to help you be more interesting.
Kumba: a victim of the rand (and several other things)
A big step forward for Nedbank in East Africa
Reinet’s underperformance vs. British American Tobacco is incredible to witness
Sasol’s business performance metrics for FY26 look encouraging
Kumba: a victim of the rand (and several other things) (JSE: KIO)
Cyclical stocks are no joke
Kumba Iron Ore has released a trading statement for the six months to June 2026. Production dipped by 3% in an environment of heavy rainfall. The impact on sales was less significant, with sales volumes only down by 1%.
The rand was actually the bigger issue, as our impossible-to-kill currency gained 11% against the US dollar. When combined with a slightly lower realised free-on-board export iron ore price (measured in USD), Kumba faced a world in which the rand price of its products was considerably lower.
There’s one more thing we need to talk about in terms of year-on-year comparability: a payment received from Transnet in the prior period that didn’t repeat in this period.
Add it all up and you get a decrease of between 30% and 35% in EBITDA. Kumba goes on to point out that 96% of the decline in EBITDA is thanks to the rand and the Transnet payment, rather than the dip in production and sales.
Either way, shareholders will have to stomach a decrease in HEPS of between 39% and 43%.
Ghost Bite: The share price has fallen 21% in the past year. Let this be a lesson to those who chase dividend yield, with the total return at negative 13% over 12 months. A juicy trailing dividend yield means very little in a cyclical downturn. The picture doesn’t improve over a longer period, either:
A big step forward for Nedbank in East Africa (JSE: NED)
Will this bring them a taste of the success enjoyed by the likes of Standard Bank (JSE: SBK) on the continent?
For many years, Nedbank’s strategy in Africa was half-pregnant with only a significant minority stake in Ecobank. It’s hard enough to achieve cooperation and integration between companies when you have 100% stakes. It’s nearly impossible when you only have one seat at a long table.
As Standard Bank’s share price left Nedbank for dead, and with arch-rival Absa (JSE: ABG) active in Africa as well, Nedbank opted to sell the stake in Ecobank at the end of 2025. This paved the way for Nedbank to announce an offer to acquire a controlling stake in Kenyan bank NCBA in January 2026.
They certainly didn’t waste any time, did they?
The results of that offer have now been finalised, with Nedbank getting the desired 66% stake in NCBA. This was achieved by allowing NCBA shareholders to sell 66% of their shares. Excess applications were also allowed, an important mechanism to make up for any shortfall (not every shareholder will want to sell 66%, while others may want to sell 100%).
In the end, holders of 79.90% of NCBA shares tendered their shares in the offer. Bears may argue that this points to an overpriced offer. Bulls will be happy to see Nedbank getting a slice of the action in Africa.
Ghost Bite: Nedbank’s total return over 3 years is 56%. Absa has achieved 63% over that period. Both pale in comparison to African champion Standard Bank and its total return of 113%!
Reinet’s underperformance vs. British American Tobacco is incredible to witness (JSE: RNI)
With 81.3% of the NAV sitting in cash, I can’t see that gap closing anytime soon
Reinet has released the net asset value (NAV) of the underlying fund as at June 2026. Although this isn’t a perfect indication of the group NAV, it usually gives us a strong indication as to the direction of the move.
There’s nothing exciting to report here, with the NAV decreasing by 0.1% between March 2026 and June 2026. But we do need to adjust this for share buybacks of €14 during the quarter.
To do this, we look at NAV per share, which increased by 0.2%. It’s still a bleak number, particularly relative to the solid uptick in hard currency AUM at the likes of Ninety One (JSE: NY1 | JSE: N91) over the same period. Investors must be asking some hard questions about Reinet’s global asset allocation.
Speaking of that allocation, a whopping 81.3% of the NAV is sitting in cash and liquid funds. Almost all the deployed capital is sitting in unlisted investments in the form of private equity funds.
Here’s the thing that really stings for Reinet: the relative underperformance vs. British American Tobacco (JSE: BTI), the asset they sold in late 2024 / early 2025. Between November 2024 and today, British American Tobacco’s share price has jumped from roughly R620 to R1,015 – a gain of 65%. Over the same period, Reinet has gone from around R485 to R437, a decline of approximately 10%.
I wouldn’t own British American Tobacco myself for ethical reasons, but they’ve got to be kicking themselves over at Reinet. This is a really unpleasant chart to look at when you were the team that chose to sell the blue line!
Ghost Bite: It’s going to take more than just a few share repurchases to close this gap. Reinet either needs to execute massive repurchases (unlikely), or they need to show the market that they are willing to take a risk on major transactions. As dry powder (cash available for deals) goes, Reinet is sitting on a warehouse full of the stuff. He’s not known as “Rupert the Bear” for nothing…
Sasol’s business performance metrics for FY26 look encouraging (JSE: SOL)
There’s positivity across the board
Sasol has released its business performance metrics for the year ended June 2026. This serves as a helpful precursor to the detailed financial results that are due for release on 1 September.
Overall, FY26 metrics were either in line with or exceeded guidance, with the exception of net working capital that struggled from various temporary factors.
The first highlight is that Secunda Operations achieved its highest annual production in the past five years, coming in 8% ahead of FY25. It also beat market guidance. The destoning project has really paid off for them.
Liquid fuels sales volumes were 13% higher year-on-year, with a positive move in refining margins as well. There wasn’t a strong finish to the year in this business though, with Q4 impacted by fuel price volatility and higher imports. Q4 volumes were down 7% sequentially (i.e. vs. Q3).
Chemicals Africa achieved volumes at the higher end of market guidance for the quarter. Revenue was up 18% sequentially, boosted by the average basket price being 23% higher.
International Chemicals enjoyed stable production and higher prices in America in the final quarter. On a full-year basis, it certainly helps that sales revenue was up 13% despite a 5% decrease in the average sales price. In Eurasia, revenue increased 7% for the year despite a dip in volumes, with a 13% increase in prices pulling them into the green. Thanks to these factors, adjusted EBITDA in International Chemicals is expected to exceed the market guidance range.
There are a number of projects underway in the group, ranging from renewable energy through to paraffin production in Italy and specialty alumina in Germany.
Ghost Bite: Sasol has returned 111% in the past 12 months, most of which has happened during the period of conflict in Iran. As a reminder of how cyclical the business is, the returns are negative on both a 3- and 5-year basis!
Results of previous poll:
Nibbles:
Delta Property Fund (JSE: DLT) is making further progress with its balance sheet. They’ve agreed to sell a property in Hatfield to a student accommodation investor for R35 million. This is an office property with a vacancy rate of 39%, so it’s not rocket science to figure out what its future probably holds. The valuation as at February 2026 was R45.9 million, so Delta is getting out at a 24% discount to the book value. With Delta trading at a price/NAV multiple of just 0.11x, even a sale at a 24% discount to book can create value! In other disposal news, the transfers of In2Fruit and 88 Fields Street have been completed, with the net proceeds used to settle debt.
Copper 360 (JSE: CPR) announced that the Rietberg Mine has moved beyond the halfway mark (in terms of depth) in its underground development. They expect to intersect ore within the next 90 days. This would mark the transition from waste development into on-ore development and in-situ production build-up (for those of you who enjoy the more technical terms in mining). Here’s the bit that anyone can understand: this ore supply, if successful, would fully utilise the company’s installed processing capacity.
ASP Isotopes (JSE: ISO) is back to using SENS as a glorified PR platform. The latest announcement is that Quantum Leap Energy (the subsidiary being dressed up for IPO) has signed a research agreement in Texas regarding high-purity uranium hexaflouride. This sounds very fancy, but this is also just business as usual for the group. In the absence of any financial information, why is this announcement on SENS?
Randgold & Exploration (JSE: RNG) announced the appointment of Allan Groll to the board. He comes with many years of property experience and is also currently an executive director at Trematon (JSE: TMT). When companies make unusual director appointments, it’s worth looking deeper if you’re involved here. Randgold is essentially a litigation-focused company at the moment, so I would put this in the special situations bucket where you need to look at the recoverability of the claim.
Southern Sun (JSE: SSU) has repurchased 3% of shares outstanding since the AGM held in September 2025. The repurchases have achieved an average price of R9.94. The current share price is R10.00.
This edition of Ghost Bites makes sense of these SENS announcements:
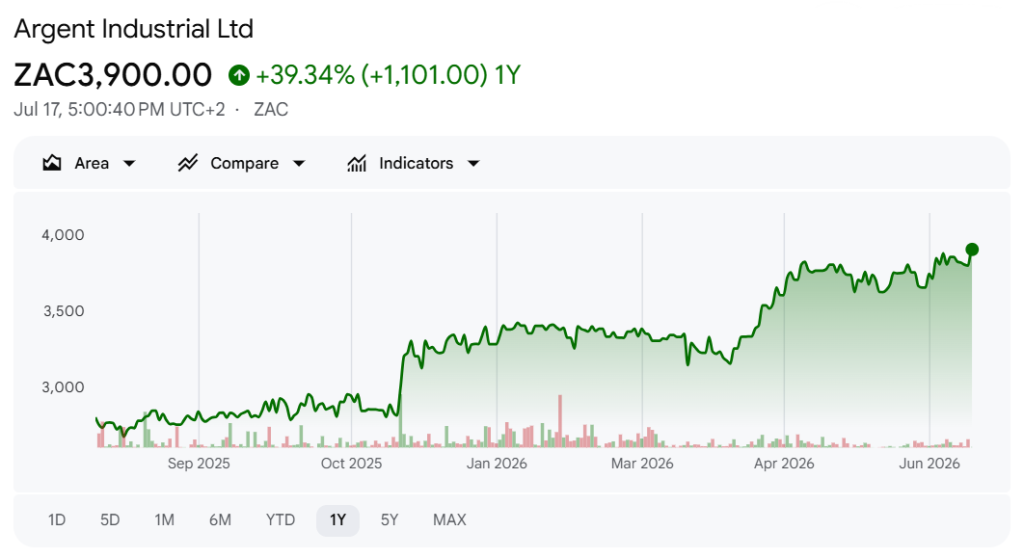
Argent Industrial lands another offshore acquisition
Aspen gets regulatory approval in Canada for its GLP-1 generic
Coronation and Ninety One gave updates on their latest Assets Under Management (AUM)
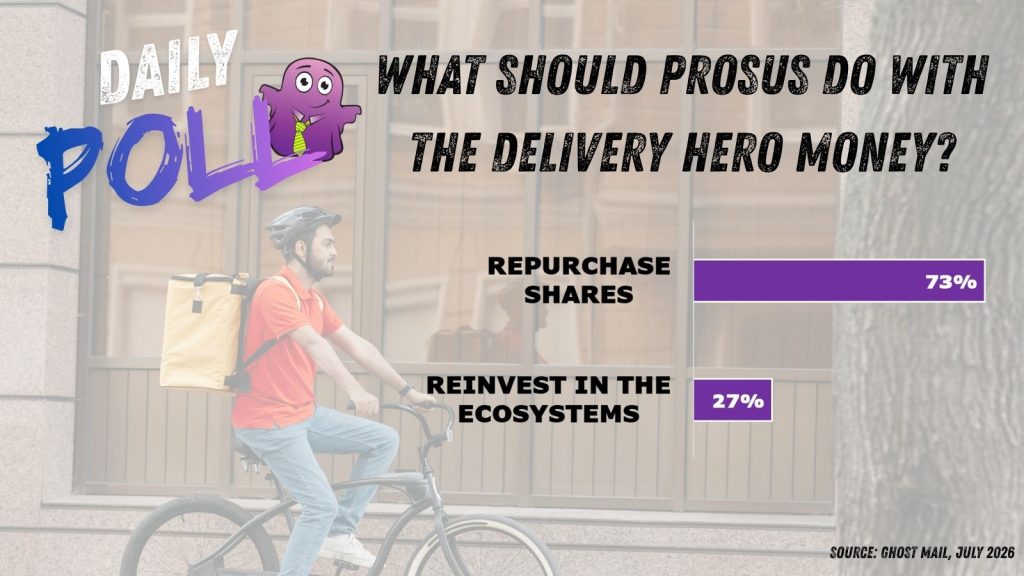
Prosus will be paid over R40 billion for the remaining stake in Delivery Hero
South32 signs off on a strong FY26
Always do your own advice and speak to your financial advisor before making any investments. The Finance Ghost may hold positions in any of these stocks at time of recording or subsequently.
Aspen gets ready for thinner clients and fatter profits in Canada – but can they get the active pharmaceutical ingredient they need for their GLP-1 generic?
South32 signs off on a strong FY26 during a key transition period
Aspen gets ready for thinner clients and fatter profits in Canada (JSE: APN)
Regulatory approval has been received for Aspen-Semaglutide
The Aspen share price chart has been on quite the adventure in recent times, although zooming out on the chart reveals a disappointing performance:
It’s been a tough road for Aspen, as the contract manufacturing space in pharmaceuticals comes with a unique set of risks. You can see the substantial drop in value in late 2025 due to a major dispute and loss of volumes. This was followed by a strong rally and partial recovery in 2026.
Aspen was a top pick for many punters coming into this year, and they weren’t wrong! But is the best of this rally behind them?
With the disposal of Aspen Asia Pacific (APAC) behind them, further momentum in the share price will need to come from good old fashioned earnings growth. This is going to require an increase in volumes, as Aspen has considerable capacity in its manufacturing operations. This means that the market smiles every time an announcement comes out that implies potential growth in volumes.
The latest announcement from Aspen is positive, as Health Canada has given regulatory approval to Aspen-Semaglutide, a generic semaglutide injectable. And yes, in case you’re wondering – this is a generic version of the blockbuster GLP-1 drug that has made Novo Nordisk a fortune.
The challenge is that Aspen’s ability to supply the drug depends on the availability of the active pharmaceutical ingredient from Dr Reddy’s Laboratories in India. There’s currently a supply issue that is expected to last until at least late October (based on Bloomberg reports).
Therein lies the challenge for Aspen: their position in the value chain means that they are always reliant on regulators at one end, and other pharma players at the other. This is a major contributor to that sideways share price chart.
Ghost Bite: The share price gained over 3% on this news and is currently trading at R155, close to the 52-week high of R160.79.
South32 signs off on a strong FY26 (JSE: S32)
The group is in an important transition phase
South32 has delivered its final quarterly report for the financial year ended June 2026. They exceeded production guidance for the year and enjoyed a strong Q4 that saw sales volumes jump by 15%.
The group is going through an important transition. They recently announced the disposal of the aluminium value chain business to Alcoa. They are also investing heavily in Sierra Gorda, a key copper asset. The construction of the Taylor zinc-lead-silver project has been going on for quite some time as well.
The overall strategy is to generate 85% of earnings from base and precious metals. They expect current projects to increase production by 55%. These are exciting times for the company, with CEO Matt Daley having taken the reins from Graham Kerr on 1 July 2026.
It helps when the underlying numbers look good, particularly with Sierra Gorda exceeding FY26 production guidance by 2%. There were various other good news stories as well, but copper is where the market will pay most of its attention. The copper price came in 42% higher for FY26.
In terms of cash returns to shareholders, FY26 saw a split of $292 million in dividends vs. just $35 million in share buybacks. To give you an idea of how enormous the capital expenditure budgets can be at these mining houses, the Taylor project soaked up $710 million in growth capex in FY26. Remember, that’s just one project!
Ghost Bite: The share price is up 35% in the past year. To remind you how cyclical mining can be, the increase over three years is just 1%. Dividends didn’t save the 3-year picture, as the total return over that period is only 9% – significantly less than a money market account at a bank would’ve returned over 3 years.
Results of previous poll:
Nibbles
Saul Saltzman, one of the sons of the founders of Dis-Chem (JSE: DCP), will be retiring from that board with effect from 17 July. This announcement comes just a few months after he transitioned to a non-executive role.
Datatec (JSE: DTC) announced the results of the scrip distribution alternative. Based on shareholder elections, the total cash dividend was only R146 million vs. an issuance of capitalisation shares worth R390 million. In other words, by offering the alternative, the company managed to retain R390 million in capital that would otherwise have been paid out as a dividend!
Harmony Gold (JSE: HAR) has reminded us of the dangers of the mining sector, with a tragic loss of life at the TauTona shaft in Carletonville. No further details are given on the accident at the shaft.
Numeral (JSE: XII) announced that results for the quarter ended May 2026 have been delayed due to the company’s focus on completed the restated 2025 numbers. The Stock Exchange of Mauritius (SEM) has given them an extension until 5 August.
Unlock the Stock is a platform designed to let retail investors experience life as a sell-side analyst.
Corporate management teams give a presentation and then we open the floor to an interactive Q&A session. I facilitate the Q&A alongside Mark Tobin of Coffee Microcaps and the team from Keyter Rech Investor Solutions.
In the 73rd edition of Unlock the Stock, 4Sight Holdings joined us for the first time to discuss the recent financial performance and prospects of the group.
Satrix Selects Botswana Stock Exchange For Secondary ETF Listings
Satrix, the leading provider of index-tracking investment products in South Africa, has announced the further expansion of its offering into another African country outside of South Africa. The company selected the Botswana Stock Exchange (BSE) as the platform for the secondary listing of three of its JSE-listed exchange traded funds (ETFs), with the listings having gone live on 9 July.
A strong track record of firsts, rapid growth and innovation has seen Satrix establish itself as a leader in the indexation market. It currently offers 38 JSE-listed ETFs, encompassing South African and global equities across various asset classes, with a total value exceeding R90 billion.*
Duma Mxenge, Head of Business and Market Development at Satrix, says, “By introducing these ETFs to the BSE, we aim to contribute to the development of capital markets in Botswana. This move will not only offer local investors a wider range of investment options but also enhance the exchange’s exposure to the international market. The dual listing of these ETFs will further facilitate the globalisation of the BSE and strengthen its position within global financial markets.”
Satrix will introduce three global ETFs to the BSE:
Kopano Bolokwe, Head of Product Development at the BSE remarks: ‘‘Botswana has consistently proven to be an attractive and a competitive investment destination, and I am proud that Satrix chose Botswana and the BSE for their Africa expansion. The listing of these three global ETFs is an crucial accomplishment under our 10x by 2030 Strategy and marks the beginning of a mutually beneficial outcomes-driven development journey. The timing is right given the positive development in the pensions and asset management landscape where ETFs are now receiving increased recognition and inflows as a bespoke asset class, supported by the fee incentives on the BSE and the innovation around bespoke ETF benchmarks. These ETFs give local investors exposure to international markets, including the USA, using an instrument that trades like shares on the BSE, and with ease of entry and exit. Thus, we encourage all types of investor groupings, such as Individuals, Investment Consortiums, Wealth Managers, Corporates, Metshelo, SACCOs’s and Pension Funds to explore these investment opportunities for portfolio diversification and long-term wealth creation.’’
“The Botswana Insurance Holdings Limited (BIHL) Group shares our collective congratulations to the Board, management and staff of Satrix on this momentous occasion. The need for such a reputable and robust partner for index-tracking products, from exchange traded funds to unit trusts and beyond – goes without saying. We are looking forward to seeing the value this will add to the local market, beyond the positive aspect of another bourse listing on Botswana’s Exchange. This is yet another testament to the growth of Botswana’s markets that we all celebrate,” said the BIHL Group Chief Executive Officer, Catherine Lesetedi.
Helena Conradie, Executive Director of Satrix says, “Our additional expansion into the African market represents another important milestone for us. As a company, democratising investments and giving as many people as possible the opportunity to ‘own the market’ is our driving force. We want to ensure economic participation for everyone. We are pleased to bring this offering to Botswana and know our innovative investment solutions and accessible fees will create new avenues for local investors to diversify their portfolios.”
*Satrix, 9 July 2026
Disclaimer
Satrix Managers (RF) (Pty) Ltd (Satrix) is an authorised Financial Service Provider (FSP no 15658) and a registered and approved Manager in Collective Investment Schemes in Securities. Collective investment schemes are generally medium- to long-term investments. With Unit Trusts and ETFs, the investor essentially owns a “proportionate share” (in proportion to the participatory interest held in the fund) of the underlying investments held by the fund. With Unit Trusts, the investor holds participatory units issued by the fund while in the case of an ETF, the participatory interest, while issued by the fund, comprises a listed security traded on the stock exchange. ETFs are index tracking funds, registered as a Collective Investment and can be traded by any stockbroker on the stock exchange or via Investment Plans and online trading platforms. ETFs may incur additional costs due to being listed on the JSE. Past performance is not necessarily a guide to future performance and the value of investments / units may go up or down. A schedule of fees and charges, and maximum commissions are available on the Minimum Disclosure Document or upon request from the Manager. Collective investments are traded at ruling prices and can engage in borrowing and scrip lending. A feeder fund is a portfolio that invests in a single portfolio of a collective investment scheme, which levies its own charges and which could result in a higher fee structure for the feeder fund. International investments or investments in foreign securities could be accompanied by additional risks such as potential constraints on liquidity and repatriation of funds, macroeconomic risk, political risk, foreign exchange risk, tax risk, settlement risk as well as potential limitations on the availability of market information. The manager has the right to close the portfolio to new investors in order to manager it more efficiently in accordance with its mandate.
Argent Industrial lands another offshore acquisition
Balwin’s take-private circular is out in the wild
Capitalworks has almost fully exited its stake in Premier
Mantengu has agreed terms for the Blue Ridge Platinum disposal
Ninety One has shown strong growth in assets under management
Valterra Platinum’s numbers look incredible at first blush, but be careful
Argent Industrial lands another offshore acquisition (JSE: ART)
They are acquiring an industrial business in the UK for R238 million
Argent Industrial has been strongly focused on building its offshore operations. In the year ended March 2026, the South African operations only contributed 27% of group profit before tax, with offshore doing the rest!
Although going offshore is no guarantee of success (often it’s quite the opposite), Argent has made it work. In FY26, offshore operations grew profit by 13.3%, well ahead of South Africa at 8.3%.
With the market enthusiastically supporting this strategy (the share price is up 39% over 12 months), Argent has now pulled the trigger on another offshore deal.
The company has announced the acquisition of the Ramsden Group, a UK-based manufacturer of steel drums and wooden pallets. They also recondition intermediate bulk containers. This certainly brings even more diversification to Argent’s group!
The deal is valued at around £10.8 million, which works out to R238 million. Of this price, almost R55 million relates to properties occupied by the group, The remaining R183 million is based on the profits after tax and a P/E multiple of 5.5x.
This is a Category 2 transaction, so shareholders won’t be asked to vote.
Ghost Bite: Based on the Argent share price over the past 12 months and how well this deal fits into the strategy, I doubt shareholders would vote it down:
Balwin’s take-private circular is out in the wild (JSE: BWN)
If all goes to plan, shareholders will get R4.35 per share
After a 30-year journey since being founded in 1996, Balwin has come full circle and will be leaving the public market (if this deal goes ahead).
The journey includes 11 years as a listed company. Balwin was one of the many property stocks that listed in the 2014 – 2016 glory years in the local property sector. This gives us a perfect example of why IPOs in a hot market are best avoided:
After a long and difficult road for investors, there’s the chance to be paid out R4.35 in cash. It sounds like a decent deal when you consider that the 52-week low is R2.31! It works out to a 23% premium to the 30-day VWAP, calculated before the firm intention announcement came out in May.
The circular for the deal is now available. This sets out all the details of the offer by Bidco, an entity backed by the PIC / GEPF and the core management team at Balwin. CEO Stephen Brookes is the biggest fish, with 33.07% stake in Balwin. The “reinvesting shareholders” (i.e. management) hold a combined 50.2% stake in Balwin.
Irrevocable undertakings have already been obtained from holders of 63.5% of the voting shares, so it looks likely that the scheme will go ahead. The likelihood is increased by the independent expert (Valeo Capital) opining that the offer is both fair and reasonable to shareholders. For more context, Valeo has estimated a fair value range of R3.62 to R4.29 per share. The offer price of R4.35 sits above that range.
The meeting is scheduled for 17 August.
Ghost Bite: It is very likely that this will bring Balwin’s public journey to an end. Unfortunately for investors, being focused on stamping out complexes in Joburg turned out to be a disappointing strategy in a city that fell apart around Balwin over the past decade.
Capitalworks has almost fully exited its stake in Premier (JSE: PMR)
These shares relate to the acquisition by Premier of RFG
You may recall that in 2025, we saw the acquisition by Premier of all of the shares in RFG.
This deal resulted in the previous RFG shareholders having 22.5% in the merged group. Notably, Capitalworks had a 44.5% stake in RFG before that transaction, so they would’ve ended up with roughly 10% in the enlarged entity.
After a successful accelerated bookbuild process run by RMB Morgan Stanley, Capitalworks has reduced that stake all the way down to just 0.94% in Premier – an easy enough stake to sell quietly, if they wish.
This is a good reminder that it’s very difficult to move a c.9% stake through the order book without the market noticing. When it’s clear that there’s a big seller in the system, it puts a lot of pressure on the share price. In such a case, an accelerated bookbuild can provide a far more elegant exit.
The price at which the sales happened is not disclosed, but we do know that Titan Premier Investments (part of the Christo Wiese stable) bought another 2 million shares from Capitalworks. This works out to around 1.2% in the company. The remaining shares would’ve been picked up by various institutional investors, with the announcement noting that the bookbuild was multiple times oversubscribed.
It’s worth highlighting that this doesn’t affect the company at all. No new shares have been issued. All we have is a situation where a shareholder needed to move a chunk of shares so large that it made sense to use a formal process.
Ghost Bite: Capitalworks initially invested in RFG in 2012. A total investment period of 14 years is twice as long as you would expect to see from a private equity fund. COVID did throw a large spanner in the works along the way.
Mantengu has agreed terms for the Blue Ridge Platinum disposal (JSE: MTU)
This is hot on the heels of the recently announced iron beneficiation plant disposal
Mantengu has been trading under cautionary since early June. It hasn’t taken them long to get to the point where they can announce detailed terms for the disposal of Blue Ridge Platinum to Afresources Mining.
The 70% shareholding and claims in Blue Ridge will be sold for R35 million. This is in line with the pricing guidance provided in June.
This gets rid of a monthly cost burden, as Blue Ridge is being kept alive at a cost of R2 million per month without generating any income. It also reduces liabilities by a massive R185 million.
Mantengu points out that this is why they didn’t raise a R570 million liability in the latest results, despite their auditors wanting them to do so. Nothing proves a point quite like the finalisation of a deal and the flow of cash!
The trickiest condition precedent is the section 11 approval under the Mineral Resources Development Act. This will need to be obtained within 180 days, so that shows you just how long these can take.
Interestingly, Afresources will lend Mantengu R35 million at prime plus 1% in the meantime, with the balance set off against the eventual purchase price. In other words, the cash bleed will stop for Mantengu while the deal is being finalised. The key is that all conditions are met though, otherwise the whole thing falls over.
This is a Category 2 transaction, so Mantengu shareholders won’t be asked to vote.
Ghost Bite: Mantengu has been making a lot of progress lately with asset disposals. The really big deal is the Averi Finance opportunity. The group is still trading under cautionary in that regard.
Ninety One has shown strong growth in assets under management (JSE: N91 | JSE: NY1)
And unlike Coronation (JSE: CML), Ninety One actually bothers to give us comparative numbers
As the name would suggest, assets under management (AUM) is the lifeblood of any asset management firm. AUM is the basis upon which fees are earned. If AUM is growing at a decent rate, earnings usually follow suit.
There are three ways to grow AUM.
The first is through a general uplift in market prices, something that is largely beyond the control of these firms. All they can do is launch funds that have a good chance of success, with the hope being that markets will do the rest.
The second is through attracting additional inflows, a function of a strong brand and a successful distribution network.
The third way, which certainly applies to Ninety One, is through M&A activity. Over the past year or so, we saw Sanlam (JSE: SLM) sell their active asset management businesses into Ninety One in exchange for shares in the group.
This transaction was a major contributor to the substantial growth in Ninety One’s AUM over the past 12 months. AUM increased from £139.7 billion to £184 billion – and do take note of the currency there! Ninety One is a huge operation.
The quarter-on-quarter growth is a cleaner view of things, as this excludes the impact of the acquisition. On that basis, AUM increased by 7.1% between March 2026 and June 2026. That’s still an incredibly strong outcome.
Ghost Bite: Given Coronation’s refusal to publish comparative AUM in their quarterly updates, I feel compelled to thank Ninety One for what feels like basic disclosure!
Valterra Platinum’s numbers look incredible at first blush, but be careful (JSE: VAL)
The priorperiod flooding at Amandelbult is making all the difference
Valterra Platinum released a trading statement for the six months to June 2026. Brace yourself for a rather bonkers percentage increase, with HEPS expected to jump by more than 1,388%!
In absolute terms, which are easier to understand here, this means an increase from R1.2bn to between R18.5bn and R22.2bn.
There were two main drivers of this result.
The first was an 85% increase in the PGM dollar basket price in dollars, equating to a 66% increase in rand.
Together with this vastly improved environment in PGMs, the second driver is that Valterra managed an 18% increase in sales volumes. But the important context is the flooding at Amandelbult in 2025, creating a much softer base than would otherwise be the case.
Amandelbult’s production was up 116% in the latest quarter. If you look at the rest of the group, you’ll find that the mines suffered reduced volumes on a year-on-year basis.
Looking ahead, guidance for full year 2026 is unchanged. The company does note that cash operating costs per ounce are expected to be at the upper end of the guided range. Given the inflationary pressure on mining costs, PGM prices will hopefully give some support to this story in the latter half of the year.
Ghost Bite: If you adjust for Amandelbult, this isn’t a particularly great outcome. The current share price of R1,080 reflects a 44% decline from the 52-week high of R1,930! The PGM sector is a wild place.
Results of previous poll:
Nibbles:
Director dealings:
The CEO of Marshall Monteagle (JSE: MMP) bought shares worth over R6.7 million in an off-market trade.
In the capital raise by Supermarket Income REIT (JSE: SRI) several directors acquired shares worth roughly R4 million in aggregate.
ASP Isotopes (JSE: ISO) had a busy day on SENS on Friday. One of the releases was the prospectus for the issuance of stock to the holders of $109 million in notes in Quantum Leap Energy. This considerable source of dilution for ASP Isotopes shareholders had already been announced, so this was just the formal release of documentation. For those who really want to dig into the detail, the company also released a retrospective update to the 2025 financials based on the presentation of Skyline as a discontinued operation. But perhaps most importantly, the company is hosting a webinar for its helium assets, as they work towards the merger with Noble Africa. The details are here.
There is very little liquidity in the shares of Putprop (JSE: PPR), so their latest trading statement only gets a passing mention down here. For the year ended June 2026, they expect a headline loss per share of between -5.26 cents and -17.44 cents vs. positive HEPS of 60.86 cents in the comparable period. This nasty negative swing is driven by a decrease in the valuation of the property portfolio. Detailed results are expected on 16 September.
Wesizwe Platium (JSE: WEZ) announced that agreements have been reached with all recognised trade unions at Bakubung Platinum Mine. This include AMCU, NUM and the non-bargaining unit. This has enabled progress to be made with the phased restart of the mine.
After another small purchase of shares, Novus (JSE: NVS) now has a direct stake in Mustek (JSE: MST) of 50.68%. Together with concert parties, the stake is up to 70.97%.
We use cookies on our website to give you the most relevant experience by remembering your preferences and repeat visits. By clicking “Accept All”, you consent to the use of ALL the cookies. However, you may visit "Cookie Settings" to provide a controlled consent.
This website uses cookies to improve your experience while you navigate through the website. Out of these, the cookies that are categorized as necessary are stored on your browser as they are essential for the working of basic functionalities of the website. We also use third-party cookies that help us analyze and understand how you use this website. These cookies will be stored in your browser only with your consent. You also have the option to opt-out of these cookies. But opting out of some of these cookies may affect your browsing experience.
Necessary cookies are absolutely essential for the website to function properly. These cookies ensure basic functionalities and security features of the website, anonymously.
Cookie
Duration
Description
cookielawinfo-checkbox-analytics
11 months
This cookie is set by GDPR Cookie Consent plugin. The cookie is used to store the user consent for the cookies in the category "Analytics".
cookielawinfo-checkbox-functional
11 months
The cookie is set by GDPR cookie consent to record the user consent for the cookies in the category "Functional".
cookielawinfo-checkbox-necessary
11 months
This cookie is set by GDPR Cookie Consent plugin. The cookies is used to store the user consent for the cookies in the category "Necessary".
cookielawinfo-checkbox-others
11 months
This cookie is set by GDPR Cookie Consent plugin. The cookie is used to store the user consent for the cookies in the category "Other.
cookielawinfo-checkbox-performance
11 months
This cookie is set by GDPR Cookie Consent plugin. The cookie is used to store the user consent for the cookies in the category "Performance".
viewed_cookie_policy
11 months
The cookie is set by the GDPR Cookie Consent plugin and is used to store whether or not user has consented to the use of cookies. It does not store any personal data.
Functional cookies help to perform certain functionalities like sharing the content of the website on social media platforms, collect feedbacks, and other third-party features.
Performance cookies are used to understand and analyze the key performance indexes of the website which helps in delivering a better user experience for the visitors.
Analytical cookies are used to understand how visitors interact with the website. These cookies help provide information on metrics the number of visitors, bounce rate, traffic source, etc.
Advertisement cookies are used to provide visitors with relevant ads and marketing campaigns. These cookies track visitors across websites and collect information to provide customized ads.
")

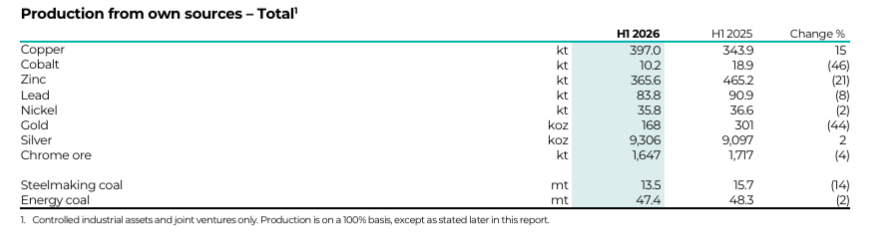
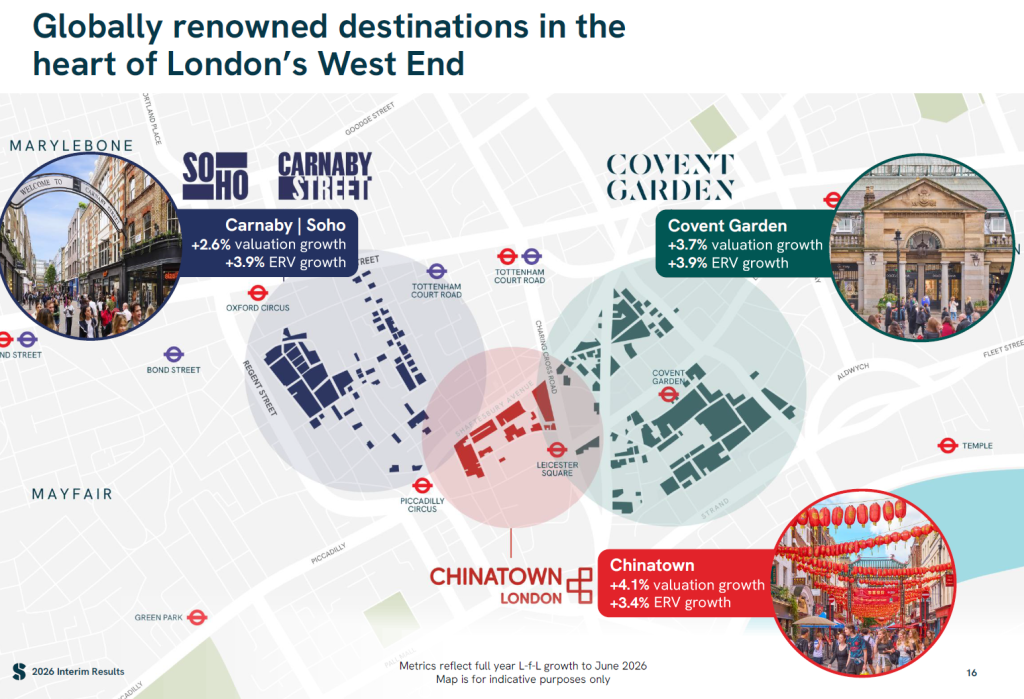
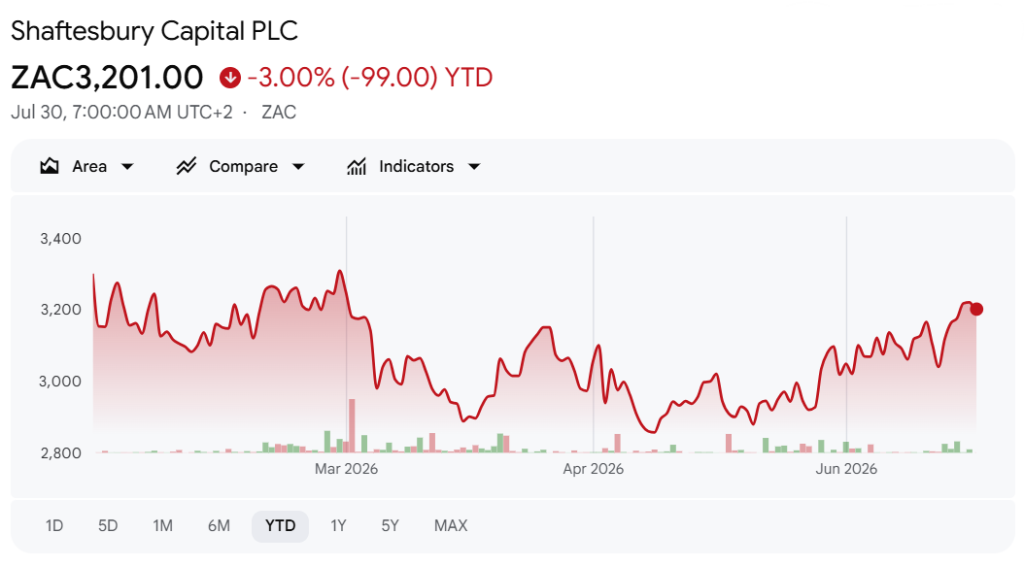
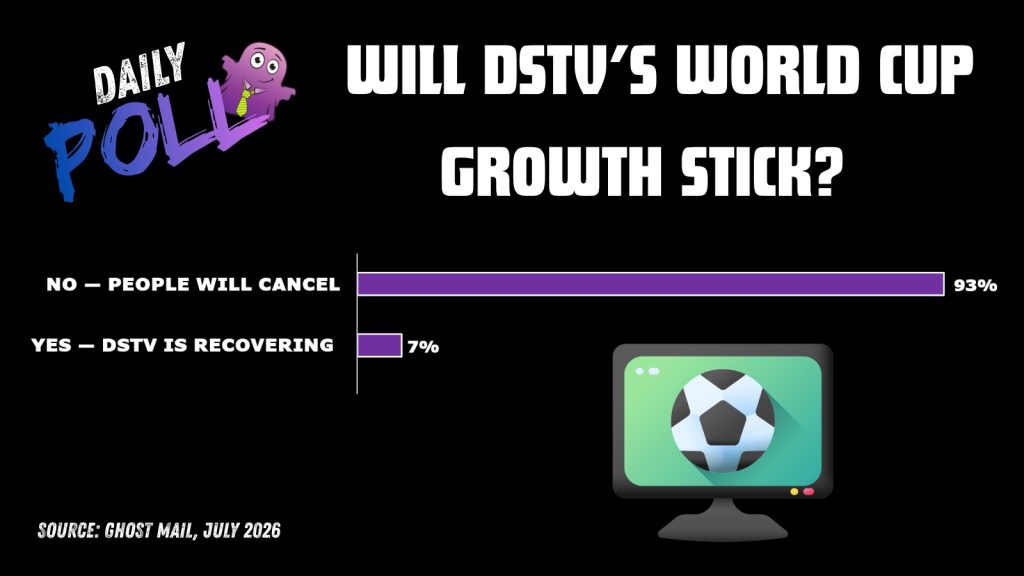
")
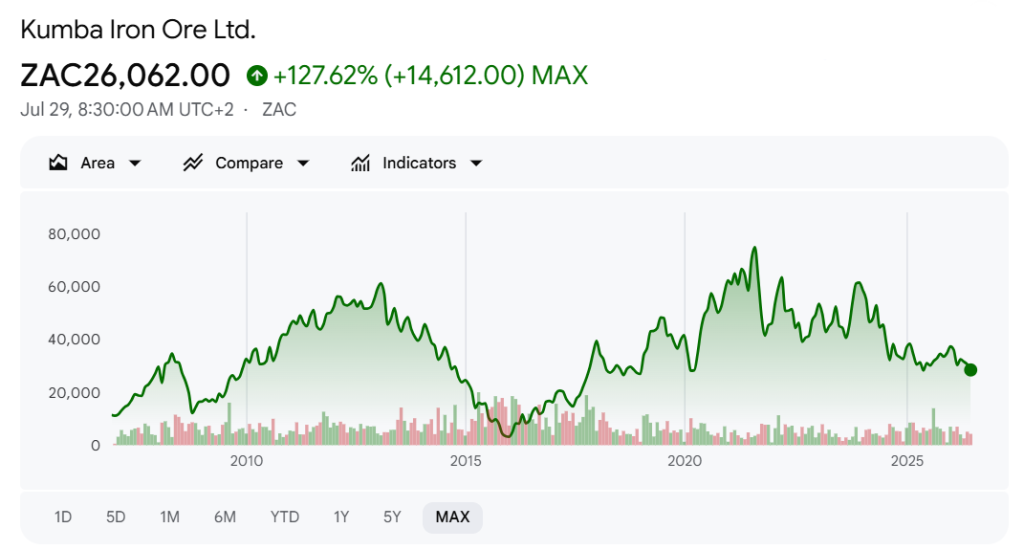
")


")
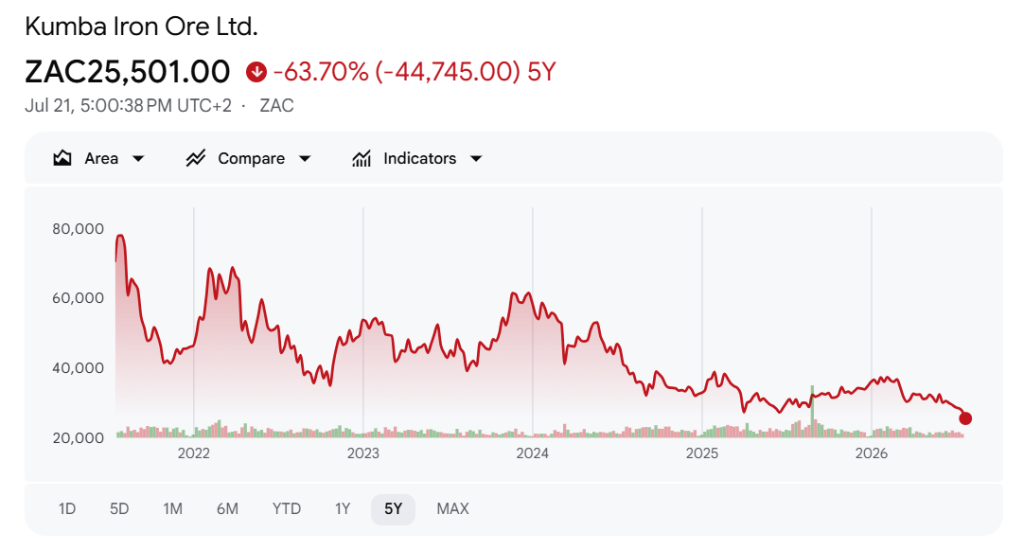
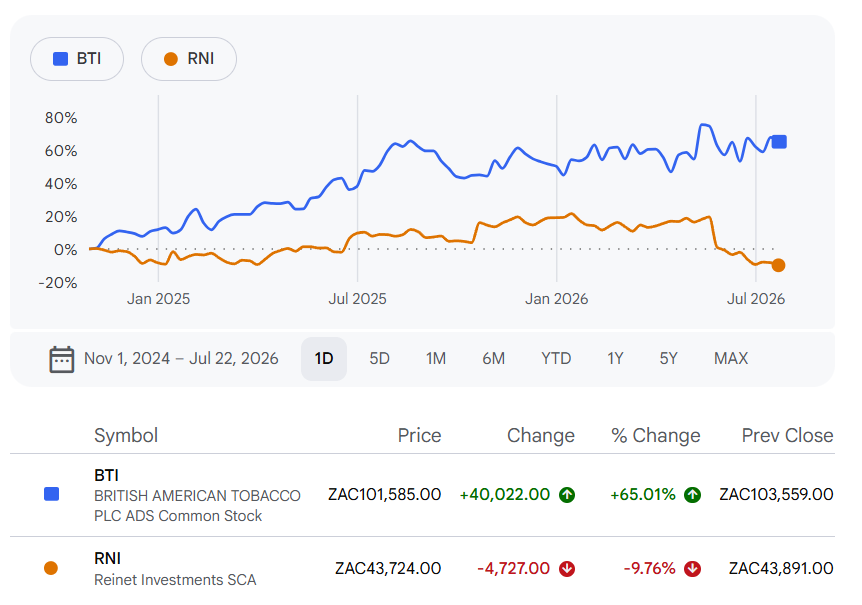
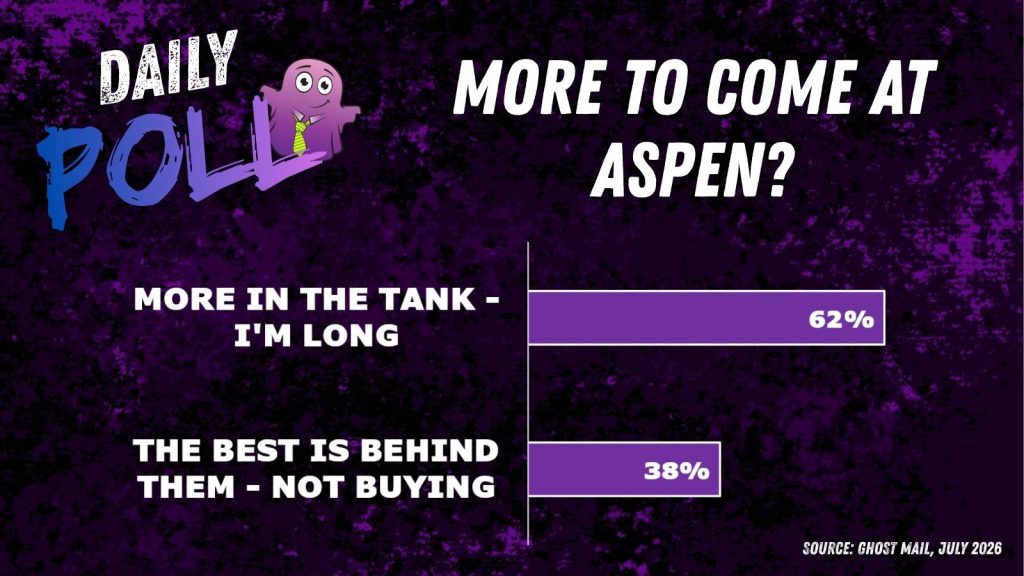

")
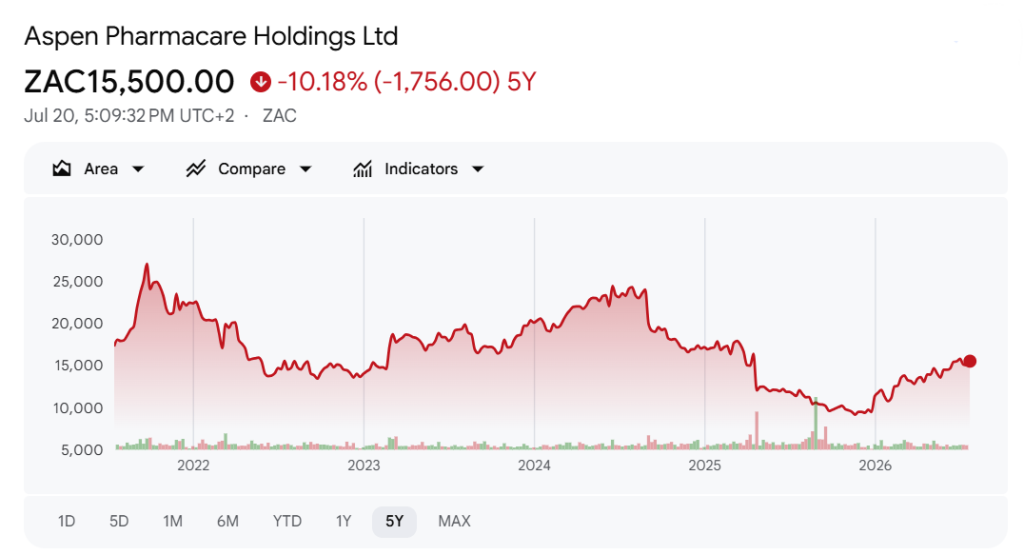
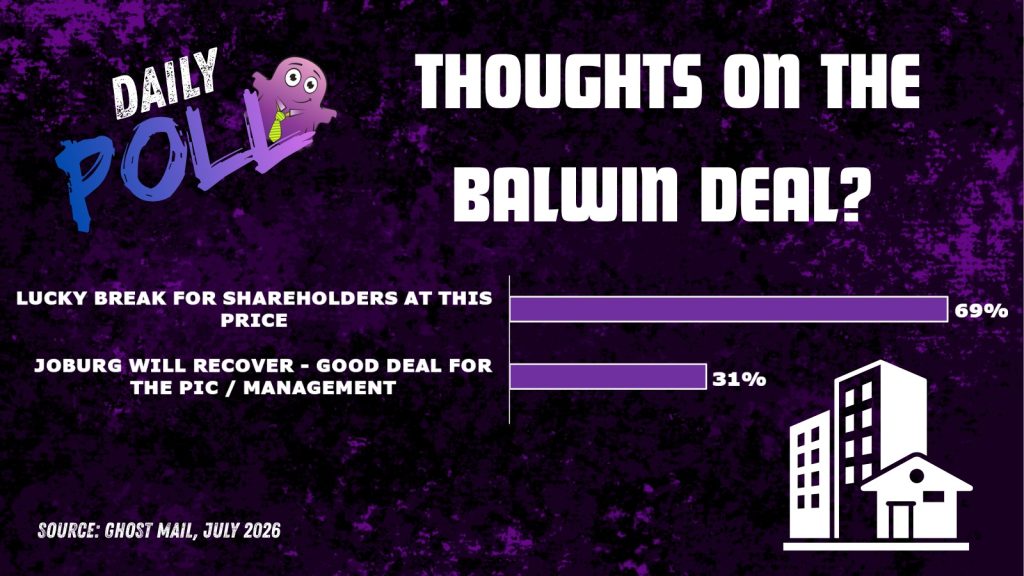


")