Monday, March 17, 2025
Home Blog Page 29

Who’s doing what in the African M&A and debt financing space?

0

DealMakers AFRICA

Paymob has raised a US$22 million Series B extension round led by EBRD Venture Capital. Other investors included Endeavor Catalyst, PayPal Ventures, BII, FMO, A15, Nclude and Helios Digital Ventures. This takes the Egyptian-based fintech’s total Series B funding to $72 million.

Nigerian fintech, Rise has acquired Kenyan investment startup, Hisa, for an undisclosed sum. The acquisition was approved by Kenya’s Capital markets Authority and gives Rise the right to operate in the East African country.

Ayady for Investment & Development S.A.E., NI Capital Holding for Financial Investments S.A.E. and Post for Investment Company S.A.E. have sold their combined 100% stake in non-banking financial service company, Tamweely Microfinance S.A.E. to a consortium comprising SPE PEF III (SPE Capital), the European Bank for Reconstruction and Development, Tanmiya Capital Ventures and British International Investment, for over EGP2,5 billion.

Andrada Mining has entered into a three-stage earn in agreement with lithium chemical producer, Sociedad Quimica y Minera de Chile SA (SQM) to partner in developing the Lithium Ridge asset (ML133) in Namibia. SQM can earn into Grace Simba Investments (the holder of the Lithium Ridge mining licence) through solely funding both the exploration and future Definitive Feasibility Study at Lithium Ridge. An initial participation fee of US$500,000 is due on signing plus an additional $1,5 million upon satisfaction of certain conditions. SQM has an option to earn a 40% stake through an investment of $20 million over a three-and-a-half-year period, with the stake increasing to 50% upon final funding of the Feasibility Study.

Egypt’s Entlaq, a company specialising in supporting entrepreneurship, has announced the acquisition of a stake in Egyptian foodtech company, Brotinni, for an undisclosed sum. The funding will be used to expand operations in Egypt and other regional markets.

WIC Capital has announced and undisclosed investment in Wood Packaging Industry, an industrial carpentry company. This is WIC Capital’s first investment in Côte d’Ivoire.

Following a competitive bid process, FBN Holdings announced that EverQuest Acquisitions LLP (comprising Custodian Investments Plc, Aion Investments and Evercorp Industries) was the preferred bidder for its 100% stake in FBNQuest Merchant Bank. Financial terms were not disclosed, and the company issued a clarification notice of the divestment, assuring shareholders that the sale was only for the Merchant Banking business and not FBNQuest Capital, FBNQuest Asset Management, FBNQuest Trustees, FBNQuest Funds and FBNQuest Securities, which would remain subsidiaries of FBN Holdings.

AngloGold Ashanti is set to acquire Centamin Plc, the operator of Egypt’s largest gold mine – Sukari, in a stock and cash deal valued at US$2,5 billion.

Nigeria’s Zenith Bank Plc has extended the closing date of its Rights Issue and Public Offer to Monday 23 September 2024, citing disruptions by the nationwide protest that commence on the day the offer opened – 1 August 2024.

DealMakers AFRICA is the Continent’s M&A publication
www.dealmakersafrica.com

Raising equity on the JSE

Access to deeper pools of capital is one of the key reasons for being listed, as the increased liquidity, profile, disclosure and regulatory protection resulting from a listing raises the potential to attract a wider audience of investors.

While the JSE has, over recent years, seen a reduction in new listings – as well as a surge of companies exiting the bourse – it remains, by far, Africa’s largest and most liquid stock exchange, with a long history as a reliable platform for companies to attract investment within a highly sophisticated financial market.

In this article, we will touch on certain key aspects for raising equity on the JSE, and strategic decisions companies must navigate to do so successfully.

Source: JSE Market Data


The above graph shows the relative decline in equity raised on the JSE in recent years, caused mainly by a higher cost of capital in volatile financial markets and a low growth operating environment. Such downturns are cyclical, and the current improved inflation and interest rate outlook – as well as initial positivity around South Africa’s new government of national unity and its potential economic impact – could signal that an improvement in equity raise volumes may be on the horizon.

While many businesses find themselves in circumstances where high inflation and interest rates put pressure on both top-level growth and profit margins, investors are also expecting higher returns to compensate for the same challenging macroeconomic and geopolitical conditions affecting the operations of these companies. The result is that the cost of equity has, in some instances, become unaffordable or unsustainable (or both), as many companies arguably trade at a discount to their intrinsic value where risk is overstated. For acquisitive parties with access to cash, this presents an opportunity; but for others, it means that their business model is not feasible (unless they are able to address this with careful capital management), and that they may be the target of a take-over.

Businesses must navigate such financing challenges to ensure that they remain optimally and adequately capitalised to deliver appropriate returns during market cycles, and thereby continue to attract capital and remain competitive.

Most companies are susceptible to cyclicality and/or the surrounding economic and political environments in which they operate. Capital budgeting is, therefore, a critical requirement as companies plan for various scenarios, and to ensure ongoing stability, downside protection and maximum growth potential.

Companies that have developed a reputation for raising well-priced capital on the JSE in the past, and have established a track record of successfully deploying it, are better placed to raise capital again in future. Successful deployment of capital into acquisitions can be highly accretive and transformative, due to the potential step growth that can be achieved. However, for other companies, a more attractive alternative could be to raise equity to strengthen their balance sheet at an opportune time by deleveraging or investing into their existing operations to support organic growth. Dividend reinvestment programmes or scrip dividends may, in certain circumstances, also be attractive capital management approaches – issuing shares in lieu of dividends, thereby retaining cash.

In the context of the South African market – where high interest rates, challenging economic conditions and policy uncertainty currently prevail – some companies are able to acquire weaker competitors at a discount sufficient to offset their own high cost of capital, thereby indirectly benefiting from a weaker operating environment. These targets are either acquired at deep discounts in the belief that, with the backing of a stronger balance sheet, they can survive what is perceived to be a temporary downturn, or immediately gain an advantage from being part of a larger enterprise that benefits from lower marginal costs and higher economies of scale.

JSE companies should pursue and communicate a clear capital management strategy and execute on it, thereby showing a consistent track record and building investor confidence for potential future equity raises. Equity raises on the JSE often succeed when a company presents a robust acquisition pipeline and a proven track record of executing accretive acquisitions effectively.

In addition to the longer-term planning alluded to above, the exact approach and mechanism for raising capital or returning capital to shareholders is specific to each company. A company looking to raise capital on the JSE, or other exchange, should engage a corporate finance advisor to assist in positioning itself for such a raise, and to navigate the various financial, market, regulatory and practical requirements to ensure the best outcome and achieve its strategic objectives.

Henning de Kock is CEO, Terence Kretzmann a Director: Head of Listed Capital Markets, Calvin Craig a Corporate Financier, and Bhargav Desai a Junior Corporate Financier | PSG Capital.

This article first appeared in DealMakers, SA’s quarterly M&A publication.

DealMakers is SA’s M&A publication.
www.dealmakerssouthafrica.com

Employee Share Ownership Plans (ESOPs): A comprehensive guide for start-ups

Start-ups face fierce competition in terms of attracting and retaining top talent crucial for success, but establishing an Employee Share Ownership Plan (ESOP) can provide a competitive edge to compete with established companies that can afford higher salaries, while conserving resources to grow the company. An ESOP is an employee benefit plan that allows employees to acquire a stake in the company through shares.

ESOPs take different forms, ranging from a share option plan – where a portion of a company’s shares are granted to the employees as fully paid at a future date and on meeting certain criteria – to phantom share schemes, where a company provides benefits that mirror ownership of shares without any legal transfer of shares.

This article discusses the considerations when setting up an ESOP, and the benefits to start-ups.

IMPORTANT CONSIDERATIONS

Vesting

There are two critical dates when establishing ESOPs: the grant date and the vesting date. These determine the relevant date for the determination of the market value of the shares in a company. The grant date is when the company gives the option of the shares to the employees, while the vesting date is when an employee acquires the full benefit of the shares upon meeting specified conditions.

The vesting period is the time between when an employee is granted the right to purchase and when the employee can actually buy the shares. A vesting schedule outlines when employees can exercise the option to purchase shares. This can take the form of ‘cliff’ vesting, where full ownership happens after several years, or a milestone or ‘graded’ vesting, which allows for gradual accumulation of ownership over time, such as a certain percentage after two years and then for subsequent years until the shares are fully vested in the employee.

Regulations

In Kenya, there are no specific regulations for ESOPs. However, the Capital Markets Authority’s (Collective Investment Schemes) Regulations, 2001 (Regulations) require public entities establishing an ESOP to be structured as a unit trust with a comprehensive trust deed and rules. As best practice, private companies aim to meet the standards required by the Regulations. A private company must, however, ensure that an ESOP is allowed by the company’s memorandum of association and approved by the board and shareholders.

It is also important to note, when structuring an ESOP, that the Finance Act 2023 grants relief for start-up employees, as they do not have to pay tax immediately on the shares acquired under an ESOP. Tax is due when the employee gains a financial benefit, either at the vesting or exercising stage. The benefit is determined by the market value of the shares on the earliest of (i) five years after the award of the shares; (ii) the disposal of the shares by the employee; or (iii) cessation of employment.

To benefit from this relief, the start-up must have been incorporated in Kenya for less than five years, have an annual turnover below KES 100,000,000, and not offer management or training services or have been formed after restructuring an existing entity.

Exiting employees

Generally, when an employee leaves before the shares have vested, any unvested option lapses. However, the scheme can provide partial vesting based on the length of employment or other specified criteria, taking into consideration the circumstances of the employee’s departure.

The ESOP can outline ‘good leaver’ provisions; that is, where an employee leaves because of serious illness, retirement, or resignation due to relocation, the employee may still be entitled to the full value of the vested shares. In the case of unvested shares, the employee may be granted the right to exercise the option in the future. In the alternative, a ‘bad leaver’ provision covers situations where an employee is terminated for misconduct or fails to meet performance standards, whereby the employee will be subject to a reduced value or no value at all for their vested options.

Termination

A company may terminate an ESOP scheme due to financial difficulty, a change in industry affecting the business, or based on a merger or acquisition. Terminating the ESOP must comply with regulatory requirements and the scheme establishing instruments, especially when it comes to the valuation of the shares. Common methods include full or partial distribution of benefits to participants, allowing them to exercise their rights within a specified timeframe, especially considering the tax implications for the employees. Alternatively, the ESOP scheme can provide that all shares are fully vested to the participants of the scheme on termination, or the company can propose a freeze of the ESOP for a certain period until a change in circumstances.

ADVANTAGES AND DISADVANTAGES

Advantages

  1. Financial conservation: offering ownership stakes in lieu of high salaries conserves financial resources by offering a flexible compensation structure without straining cash flow.
  2. Employee retention: gradual ownership helps retain top talent, ensuring continuity and stability.
  3. Morale and alignment: an ownership mindset encourages a collaborative and inclusive workplace culture.
  4. Increased productivity: ownership incentives motivate employees to dedicate themselves fully to the company’s success, leading to higher productivity and improved performance outcomes.

Disadvantages

  1. Dilution of ownership: issuing equity to employees dilutes the ownership stake of founders and investors, potentially restricting control over strategic decisions. A phantom share scheme would be preferable, as it does not grant legal ownership of shares.
  2. Share price fluctuations: higher share prices are dependent on the company’s performance. ESOPs are beneficial to employees of companies that produce predictable and consistent financial results. This might be difficult for start-ups, making the ESOP less beneficial for retaining employees.

Striking the right balance between ESOP compensation and cash compensation is essential to ensure employees can meet their immediate financial needs while still being incentivised by the ownership opportunity. Therefore, founders need to be clear on the aim of the ESOP based on their industry, and carefully consider the structure that will benefit both the entity and the employees.

Njeri Wagacha is a Partner, Rizichi Kashero–Ondego a Senior Associate, Sheilla Mokaya an Associate and Wambui Kimamo an Intern I CDH Kenya

This article first appeared in DealMakers AFRICA, the continent’s quarterly M&A publication.

DealMakers AFRICA is a quarterly M&A publication
www.dealmakersafrica.com

The Trader’s Handbook Ep6: trading signals, market trends and strategic indicators

The Trader’s Handbook is brought to you by IG Markets South Africa in collaboration with The Finance Ghost. This podcast series is designed to help you take your first step from investing into trading. Open a demo account at this link to start learning how the IG platform works.

Listen to the podcast using the podcast player below, or read the full transcript:

Note: examples used in this podcast should not be interpreted as advice. They are for informational purposes only.


Intro: Welcome to The Trader’s Handbook, a limited podcast series brought to you by IG in partnership with your host, the Finance Ghost. Over the course of our upcoming episodes, we are delving deep into the world of trading, helping both novice and seasoned traders alike navigate this exciting field. Join us as we unravel the intricate strategies and insights that define this dynamic landscape and the beautiful puzzle that is the markets. IG Markets South Africa is an authorized financial services and over the counter derivatives product provider CFD. Losses can exceed your deposits.

The Finance Ghost Welcome to episode six of The Trader’s Handbook and thank you for making time for us in your busy week. This is a great podcast series that I’m collaborating on with IG Markets South Africa. As ever, Shaun Murison of IG is here with us to share his endless insights into trading. And I must say, I have already learned a lot actually, and the results are starting to show in my demo account, although it does seem to depend on when I open it. Some days look better than others – welcome to trading! Anyway, perhaps more on that later. Welcome, Shaun. And you must be pretty excited to talk about some of the topics we’ve got lined up today, like technicals and trading signals. I mean, this is very much your wheelhouse, isn’t it?

Shaun Murison: Yes. Great to be here again, and that’s my favorite thing to talk about. Obviously, technical analysis is something that I do believe in and something I employ in my personal trading. Yeah. Excited about this one.

The Finance Ghost: Fantastic. I know you had a rough morning of traffic following the trend of people driving to work, trend following in the markets is definitely a bit more fun!

I’ve certainly learned over the past couple of months that trading is actually very different to investing. I obviously knew this to some extent, but I think you have to actually experience it to know for sure. And that’s why the demo account is just so important. We keep encouraging people to open one and give it a bash themselves because you really need to see this stuff play out real time as the strategies are different.

Speaking of time, the time horizons are really different. My background is very much one of investing, not trading. This is a new skill for me. Investing is a much longer time horizon than trading. In trading, this means that being tactically correct seems to be more important than getting things strategically right over the long term.

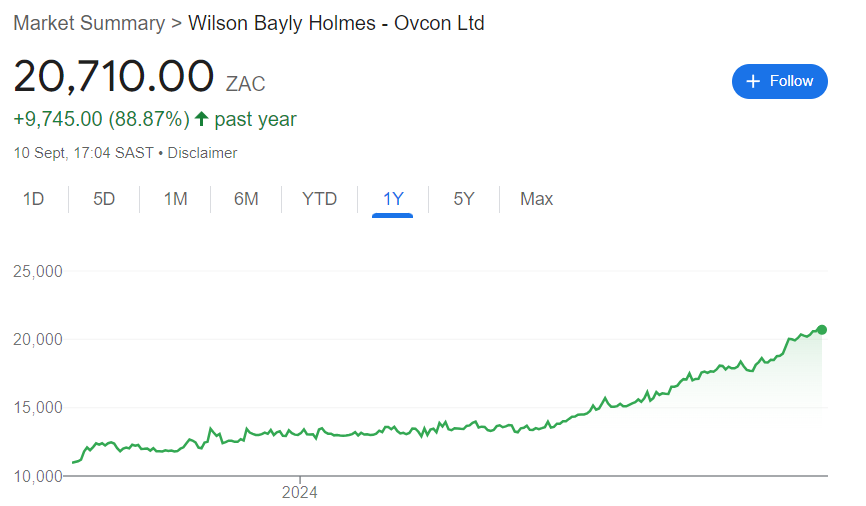
I’ll give one recent example from my demo account. I took that advice of actually focusing more on what the trend looks like and a little bit less on what I think this company looks like ten years from now. I went long Telkom in my demo account. I don’t think I would dream of being long Telkom in my investing account, but the trade worked magnificently to be honest. The reason I did it is because I looked at these South African stocks that had already run in the post-GNU euphoria and Telkom was left behind. Honestly, nothing had happened in that share price and it didn’t really makes sense to me.

If the whole of SA Inc has moved up, logically why didn’t Telkom? I had it on a watch list and then I learned that ideally you need to wait for some kind of confirmation that you’re not the only person in the world who thinks this way. Doesn’t help to be, you know, the only penguin in Antarctica who thinks something. You need to have a whole lot of other people believing much the same thing, because that’s what makes a market move. And when I saw it start to have some positive momentum, I went for it and I’m bearish telcos in general. So that’s why I say this is a good lesson for me in trading versus investing, because I wouldn’t be long Telkom any other way. But it doesn’t matter when you’re trading – what you’re looking for is what the chart is telling you and the momentum.

Of course, the skill to develop in that space, or at least one of the skills, is to understand technical indicators. That’s how traders do a lot of the work that they do. I think it’s actually quite useful for investors, too. I firmly believe that even for a dyed-in-the-wool long term investor, it’s very foolish to ignore some of what you can learn from traders, because why wouldn’t you try and time your entry point a bit better, you know? And Shaun, you said a few times before on this series that markets are basically a voting system, which is something that has definitely stuck with me. How does this actually relate to technical indicators? Why do these things actually work and do they work?

Shaun Murison: Look, the subject is very broad and I think there are some concepts that work better than other concepts. But when we talk about a voting system, if you are subscribing to the idea of technical analysis or using technical analysis, the summation of those votes would essentially be the price. To me, when you’re looking at technical analysis, your price is your best indication.

The first technical indicator that you should look at, because if you think about it very simply, is price – that share price, or that FX price, or that commodity price is aggregating all the data out there. Rational investor, irrational investor, retail trader, asset manager – it’s summarising all that information and spitting out a result, and that result comes out in the price.

Technical indicators are generally derived from price or volume, or price and volume. It makes sense as a starting point to look at that price information because it will spit out a result and that will result in a trend. Then we say, okay, well, the market’s in an uptrend and we can assess what we think we should do next. When we see prices turning from down to up, essentially it’s giving us an indication that selling pressure has reverted to buying pressure. It’s a major turning point where buying has come into the market. I think good technical analysis will reflect what’s happening fundamentally in the market. It’s our job just to just try gauge that general direction using these indicators and hop on board.

The Finance Ghost: For those who aren’t familiar with what technical indicators actually are, let’s compare it to fundamental analysis which is very much about digging into the company’s income statement balance sheet, their outlook, a lot of what they are saying, looking at stuff like margin trends over the last couple of years. That’s something that I always do. I look at what’s happening with working capital etc. – it’s very much this deep dive type of thing. And obviously the depth varies. You get people who really do go and read as much of the financials as they can. I very much apply an 80-20 principle because the amount of time it would take me to read every company to that level of depth is going to more than offset the benefit I would get from it, because time is the only truly finite resource in this world.

Technical indicators, that’s something completely different, actually. That is very much based on share price charts. It’s looking at how the price is moving, not necessarily what the underlying company is actually doing. Is that the best way to summarise the difference between the two? Because not everyone will be familiar with this concept of technical indicators.

Shaun Murison: Yeah, it’s summarising everyone’s assessment and how they’re taking action on that share, rather than looking at those fundamentals that are driving price, we’re looking at actual price, the result of how people are interpreting those fundamentals.

The Finance Ghost: When I started to realise that technicals are well worth paying attention to, I’d look at how a share price would move in relation to something like earnings coming out or whatever the case may be, and the thing would move 3%, or 6%, or 5%. It’s hard to make a case for why it was 3%, or 6%, or 5% on a fundamental level. But then you go look at the chart and you see, hang on, that’s really interesting, this thing dropped down to levels where I’ve seen it trading in the past year. And isn’t it interesting how it seems to drop to those levels quite often and then turn higher? In your world, Shaun, that would be a support level. If you look at enough charts, you can see a lot of this stuff is real. It works, it’s out there, I can see it. And that’s what makes it, I think, quite exciting.

I would imagine that some of the technical analysis then turns into this concept of trading signals. I always get that horrible image in my head of the classic “selling forex” trading courses advertised on the side of a Mercedes AMG, that Instagram cliche. That’s obviously not what this is. We’re talking about proper trading here with a reputable, licensed, proper place. But let’s get into trading signals and how these relate to technical indicators. Are these things actually related or are they completely separate concepts?

Shaun Murison: Okay, so I think you’re referring to IG signals, trade ideas generated in the platform. If you log into the IG platform, we have a whole lot of tools to help you analyse the market. Client sentiment indicators generally show you how clients are placed on a position – majority long or majority short. We have fundamental data. You can access balance sheets, income statements etc. and then technical analysis tools as well. Now, the signals function is shorter-term trade ideas, which are generated using technical analysis indicators. Those are third party experts and they look at different asset classes. Those trading signals are related to technical analysis or technical indicators.

The Finance Ghost: Yeah. And the point is, there’s a lot of stuff sitting behind it, like client sentiment, a lot of that data that you guys have. That’s why I want to clearly differentiate this from some of the real nonsense you see on social media. It’s quite damaging, I think, to the entire industry when I see stuff like that. I actually see less of it these days. I don’t know if it’s been clamped down on. I’m really hoping it has, because it’s super damaging, maybe it’s just not so much on Twitter or X now because it gets shut down. I’m sure there’s still plenty of it on Instagram and goodness knows where else, probably on TikTok. But I think that process in the background to create these trading signals must be pretty interesting, actually. Things like measuring the sentiment, etc. Who do they get sent to? How often is it and on which devices? Is this something that every IG client gets their hands on? Is it something that is ever made available to non-clients?

Shaun Murison: Those trading signals all generated under the signals tab on the IG trading platform are third party research, generated by companies PIA First and Autochartist, independent analysts with decades of market experience. To get those ideas, you would need to log into the IG platform on your computer or on your mobile device. If you’re not an account holder, you still have access to something like a demo account where you can still access that same data and all the client center data and all those other things are also still there, even if you don’t have a trading account with us. So, yeah, it is accessible via the demo account system.

The Finance Ghost: Just on the subject of devices, what is the option to trade on a mobile, on IG versus desktop for example?

Shaun Murison: I mean, with an IG account, you can access the markets through your trading app, or you can download an app directly to your phone. It’s the same account, it’s just linked and in different formats. Obviously, on a laptop, you have access to a little bit more in terms of research and capabilities. The screen’s bigger. You can do more on a computer than a small screen via mobile device. But most things are accessible on either mobile or the mobile app, or from your trading platform on your computer.

The Finance Ghost: Yeah, I’m also a little bit old school when it comes to screen size. My mobile is still not something that I run my whole life on, unlike some people who I know do get that right.

Shaun Murison: Yeah, I mean, you can see that appetite for mobile trading has grown. I think more than half the transactions done through trading through an IG trading account are now via mobile device rather than from an actual computer. People like to be on the go. They like to watch their charts and stocks and portfolio from anywhere and don’t have to be logged into their desktop.

The Finance Ghost: I imagine a lot of trading going on in the back of Ubers on the way to somewhere else and all sorts of things. Fascinating. So just one more question on these. Well, actually, a couple more questions on the trading signals. I don’t think we’re done with that quite yet. And one of them is in terms of which markets these are actually available for. Is this across the whole set of indices, forex stocks etc? I know my background is stocks, so I tend to frame everything in that way, which is actually not right. And that’s something that, as we go through the series, we’ll need to actually lift the lid on some of the other stuff you can do, forex indices etc. There’s certainly more to life than single stocks, shockingly for me!

Shaun Murison: I think we should talk about some of those other products on one of the future podcasts because there benefits to some of the other asset classes. Certainly cost would be one of them.

But in terms of, you know, what markets trading signals are available for, it’s generally forex, gold, oil, broader commodities indices. There’s not the whole suite of shares offered on trading signals at this point in time. The other analysts and I do provide trading views on a number of companies and that would be content created for the IG website, whether in video form or in written form.

The Finance Ghost: Okay, perfect. And the reality is no one can get every single trade right. Absolutely no one. It’s one of my pet hates, when I see some of the really rubbish online content. It’s just nonsense. No one gets every trade right. Anyone who’s telling you they do is full on lying because the markets are not that easy. So in terms of these trading signals, I guess it’s a hard question to answer, but how reliable are they really? Maybe asked differently, what is a good win rate for a trader? And do these trading signals tend to drive those kind of percentage win rates? I know it’s a tricky question, but I think it’s important that people understand that just because you get a trading signal doesn’t mean it’s going to work every single time.

Shaun Murison: Yeah, look, past is not indicative of future. I mean, obviously you read that everywhere.

The win rate can be misleading because if you say that, it really depends on the type of strategy you’re employing, right? If you’re trading and you have a higher win rate, then what are your losses relative to the profits? If you’re taking small profits and running big losses, that system is still not going to be profitable, even if you’re right more often than you’re wrong. On the flip side, you might have a situation where you’re only right 40% of the time, but you’re making a hell of a lot more money when you’re right than you’re losing when you’re wrong. A system like that can still be profitable and there are a lot of different ways to view it.

But in terms of the trading signals that are offered on that platform, I think they vary in terms of success rate across different asset classes. They’re there to teach and I always encourage people to do their own analysis first and use that as a cross-reference. If you are interested in those signals, maybe just look at them on the asset classes that you’re looking at trading. Run them forward, compare them to analysis and see how you find them. If you find that they’re not working out as well relative to your approach to the market, then, well, you could do the opposite.

But I’d say just track it if that is something of interest to you.

The Finance Ghost: Yeah, it’s quite funny to think of people just basically doing the opposite. I remember in my investment banking days I spoke to someone on the desk and I remember them saying they had this favourite analyst because he was always wrong. I thought, but that’s terrible! And they were like, no, no, no, it’s great because he’s always wrong. It’s fine, just be consistent. If you’re always right, if you’re always wrong, I can work with that. It’s when you get it mixed then it gets a bit harder.

Shaun Murison: Look, just on that, we know the stats on retail traders and we post them on the website. We have those client sentiment wheels on the platform as well. And so when you look at those client sentiment wheels, some people say, well, you know, that can be seen as a contrarian indicator as well. If the herd is going long, maybe it’s time to go short on something. If the herd is going short, maybe it’s time to go long, but that is obviously in the public domain and obviously IG is one of the biggest in the world. In terms of the retail sentiment that we provide to our clients in that platform, it is quite an interesting indication.

The Finance Ghost: I’ve learned the hard way, as we’ve shared on previous shows, that contrarian short and contrarian long are not the same thing. I think the contrarian longs, you’ve got a lot better chance of coming out okay. Contrarian short is properly risky stuff.

I would refer people to that pairs trading show that we did previously, which is a very good way to take a short view on something, but to change that trade a bit by taking a long view on something else. That pairs trading show was cool, and I’ve actually done a pairs trade now. We’ll see how that one plays out.

I think let’s get into some of these technical trading indicators. Now, obviously, we recognise it’s not so straightforward on a podcast to talk about this stuff because ideally you need to see a chart in front of you. What I’ll do is I’ll make sure that in the show notes, there are one or two examples, and then you can go find that on the website. Go check it out.

We’ll start slowly with the technical trading indicators, as we do need to cover them. And what I think we should cover first is maybe just the basics like trend indicators as a nice place to start. Something like moving averages, for example. I’ve seen shorter term ones, like 20-day. I’ve seen longer term ones, like 200-week moving averages. Just work out how long 200 weeks is – that’s a very long time worth of market data.

Why are these things useful, Shaun? I know they’re useful because I’ve seen them referenced enough times, and I’ve seen stocks behave in a certain way relative to those moving averages. Obviously not every single time, but they do seem to be a pretty useful indicator. So how do these things actually work, and why are they helpful?

Shaun Murison: Okay, so let’s start off with the moving averages. Earlier on, I said most technical indicators are derived from price activity, whether it’s a share price or commodity price. And so, when you look at a moving average, it’s just smoothing out that price data. It’s averaging out the price data. If you looked at a 20-day moving average, it’s an average of the last 20 days of share price data, which would be considered shorter term. If you’re looking at a 200-day moving average, it’s considered a little bit long term when you’re looking at the short term trading type environment.

And just a simple application of that as the way to assess what’s happening in the market: what is the trend?

If the price is above that moving average, the trend is up. If the price is below the average, that trend is down. We make a habit in technical analysis of trying to follow the general trend. That’s just one gauge that you can use to help assess that trend. When you’re talking about moving average crossovers, that’s a little bit fancier here. We add two moving averages to a chart, and we’re looking for shorter moving average to cross above that longer term moving average, let’s say 50 above the 200, and say, well, those two trend lines, it’s a stronger signal that there’s an uptrend in place.

Source: A Traders’ Guide to Moving Average (MA) Strategies | IG South Africa

Coincidentally, that’s actually a famous signal: the 20 above the 50. It’s called the golden cross. This is supposed to be quite bullish for markets. Inversely, when that 50 crosses below that 200-day simple moving average, that’s supposed to be a bearish signal, a negative signal for markets referred to as the death cross.

For me, the way I use it is that I know that the trend is up, but it might not be an indication for me to get in right now. It’s saying which side of the market should I be on when I get in? And I might use other technical tools like price levels or other indicators to time buy signals into an uptrend or time sell signals into a downtrend.

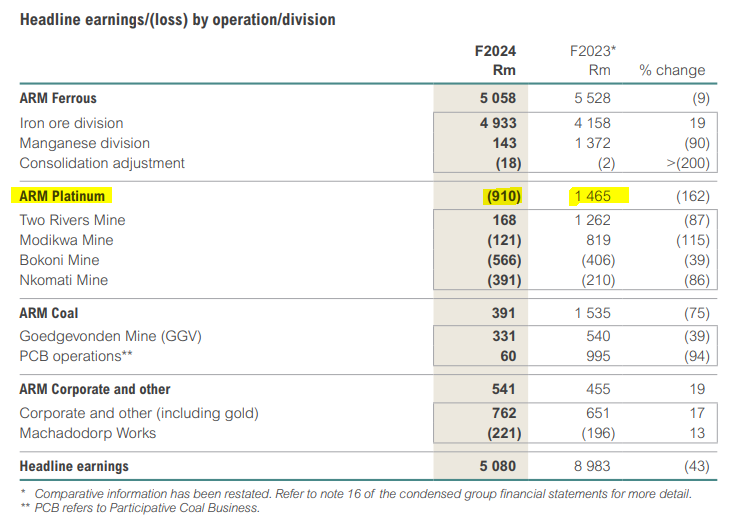
The Finance Ghost: Yeah, the opposite of the golden cross, usually called the death cross – and maybe given where the PGM sector is at the moment, it should be a golden cross and a platinum cross on the way down! PGMs have taken so much pain, we can just keep the commodity theme in there.

These things are useful, and if you see them play out on a chart, you’ve got to actually practice with the stuff – you’ve got to see it in the flesh. It’s very, very hard to believe that just adding some kind of moving average to a stock price chart really helps you, but it does. That is the reality.

Practically speaking, how do traders actually do this? For example, on the IG platform, can you go and add all of these moving averages to any stock price chart, or do you need to do it somewhere else as part of your analysis and then bring that through to executing a trade?

Shaun Murison: No, moving averages, like a whole host of technical indicators, are available on the IG platform. It’s just a matter of clicking on the indicator tab, adding it to your chart, and it obviously automatically computes that for you. You just need to change the settings. Maybe you prefer using a 200-day moving average, then change the setting to 200. It’s an automated process. You can do it on mobile, you can do it on the platform. Very, very easy.

The Finance Ghost: Yeah, perfect. And that’s where you start to see people posting these very intricate charts online. If you’ve followed any of the good accounts on this, you’ll often see them post a chart where it’s not just a share price, it’s often got a whole bunch of other lines on it. If you’ve always wondered what those are, the various different lines, one of them is almost certainly going to be a moving average because it is quite a commonly used technical indicator. It’s got to be one of the most commonly used ones, right?

Shaun Murison: Yeah. The very, very popular one is a 200-day moving average on a daily chart. The saying goes that the bulls live above the 200-day moving average and the bears live below the 200-day moving average. It’s just a simple filter for a longer-term view on the market in terms of which side of the market you should be on, which way you should be trading the market.

The Finance Ghost: Yeah, that makes a lot of sense. It goes back to that point about being contrarian. If you are sitting above that average and you’re feeling bearish, you’ve got to understand that you are doing something different to pretty much everyone else and you need to be careful. It doesn’t mean you’re wrong, it just means you need to be careful. All comes down to risk weightings, right?

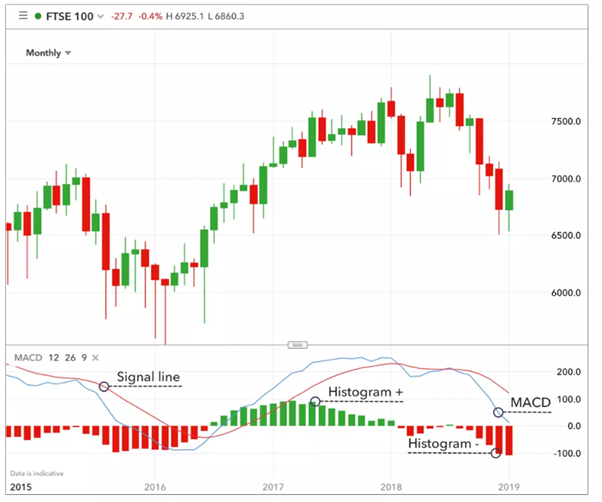
I think let’s do one more technical analysis piece just to end the show. And that is the MACD or the moving average convergence divergence. Now, this is starting to sound quite fancy, of course, and it uses moving averages and a histogram. What we’re just trying to show you here is that drawing a basic 20-day is a very entry level step into technical analysis. There really is a lot more that people can do. And again, you know, this is something that I saw on that academy article, which I’ll post the link to, but I think just high-level, this is a nice example of how fancy some of the moving average analysis can get. It’s a nice place to end off and leave people wanting more in terms of how interesting this stuff is. So, more or less an explanation of how MACD works, what is the thinking behind this thing? Is it widely used? Is it a bit niche?

Shaun Murison: Okay, so the MACD is one if you want to impress your friends. You could add it as a chart and there’s a lot going on there. But like you said, MACD stands for moving average convergence divergence. It’s actually not that difficult when you break it down. It’s just showing you the relationship among multiple moving averages. You’ll see there’s a zero line on that indicator. And when that blue line, the MACD line, crosses above zero, it’s saying that these two moving averages are crossing in a positive fashion, the assumption there would be the market’s in a positive trend. When that blue line crosses below the zero line, it’s saying that there’s a negative cross of those two moving averages and so bearish assumptions for the market.

Source: How to Use the MACD Indicator when Trading | IG South Africa

In the simplest of forms, MACD is actually moving averages just represented differently on your chart. Instead of putting a moving average on the price or overlaying it on the price, it’s a separate indicator window at the bottom. But it is mathematical formulas and it’s a different representation of moving averages.

The Finance Ghost: When you say MACD, it just makes me hungry! I think of the Big Mac Index, which is for purchasing power parity. Maybe the golden arches should be a technical indicator there as well somewhere?

Shaun, I think it’s really been a great show and a very nice intro to just some of the concepts in technical analysis. Obviously, we’re going to talk through more of them. I think we’ll try and build it into different shows rather than having literally 25 minutes straight of technical analysis. But we’ll see how it goes because it can be quite hard to follow if you’re not sitting there with the charts. And the last thing I just wanted to raise, I alluded to it earlier, that I’ve done a pairs trade now, so we’ll see how it works. I decided to go long Nedbank short Standard Bank, so short the “better” bank and here comes my contrarian side. In a pairs trade, you need to be contrarian because you need a gap to close. Nedbank was sitting on a single digit P/E when I looked. Standard Bank has enjoyed a better valuation and a big part of my thesis is just the sheer amount of selling by Standard bank directors recently.

That’s not a technical indicator, but it is something that investors use a lot and I think traders should look at as well: what are insiders doing? And you’ve obviously got to differentiate between someone just taking share options and bombing them into the market to pay their tax or even just selling all of them. That is a signal, yes, but I think it’s when people have been hanging on to shares for a long time and they start letting them go at a time when other stuff looks a little bit worrying as well – that’s a very nice indicator.

Some of Standard Bank’s challenges include their China exposure at the moment and some of the African currencies they’re exposed to. Let’s see what happens.

As I said, it’s in my demo account. I’m going to see how it goes. It’s one of those trades where you have to have a strong stomach, like so many. The first day I looked, it was thousands in the green and then I looked again and it was in the red. But that’s just how it goes. That’s why you need to make sure your position sizing is correct. And that’s why the demo account, I think is just so important as a starting point for anyone.

I’ll finish there and just refer people to go and open that demo account, give it a go. Go back and enjoy the other shows in the series. There are a good few of them now. Shaun, as always, I look forward to doing the next one with you. We can see whether my pairs trade is working out or not. We will no doubt also have a look at a bunch of other great things. For now I was happy to bank the Telkom money, so thank you for teaching me something about the importance of following a trend in trading and putting some of my fundamental hats back in the cupboard. I’m not trying to own this thing for ten years. Sometimes, I’m trying to make a quick buck, literally, and move on.

Thank you very much for all the insights and as I say, really looking forward to the next one.

Shaun Murison: Cool. Thanks for having me.

CFD losses can exceed your deposits.

In our gorgeously diverse country. There really is a new reason to trade every day. Current affairs to political news can make the markets move and cause volatility, which can be advantageous to a trader. Diversify your portfolio by opening a trading account with IG and explore the possibilities of CFD trading or practice your trading skills on an IG demo account.

Ghost Bites (Anglo American | Anglo American Platinum | Growthpoint | Hyprop | Murray & Roberts | Mustek | Pan African Resources | Super Group)

4

Get the latest recap of JSE news in the Ghost Wrap podcast, brought to you by Mazars:


As expected, Anglo’s placement of Amplats shares was at a deep discount (JSE: AGL | JSE: AMS)

This seems to have hurt shareholders more than just unbundling the stake

When I first saw the announcement by Anglo American about the placement of Anglo American Platinum shares with institutional investors, my immediate thought related to the discount that would be required to get it away. Sure enough, they placed the shares at R515 per share vs. the closing price on the day of the announcement of R570. That’s a discount of nearly 10%!

The benefit? Anglo American can put R7.2 billion in cash on its balance sheet before moving forward with unbundling the rest of Anglo American Platinum to shareholders at some point in future. If they need it for any taxes or transaction costs, they aren’t explicit about that. This makes me suspicious that this was purely a last attempt to shore up the balance sheet before passing the platinum hot potato to shareholders.

This is the same management team that told us how the BHP offer to Anglo would be too painful to implement, given the requirement to carve Amplats out of the deal. Their solution feels a lot like taking the painful route anyway, without the benefit of the BHP deal.


The V&A Waterfront remains the shining star at Growthpoint (JSE: GRT)

Higher interest rates across the group impacted earnings this year

Growthpoint has released results for the year ended June. This is essentially a macro view on South African property, with significant exposure to Australia and the UK as well (offshore investments contributed 32.4% to Growthpoint’s distributable income per share). Buying Growthpoint is almost like buying a property ETF, whereas choosing one of the smaller REITs is a decision to take more focused exposure.

The V&A Waterfront is by a country mile the best part of the Growthpoint story, contributing distributable income of R775 million and growing 12%. For context, group distributable income decreased by 10.3% to R4.8 billion. On a per-share basis, it fell by 10.0%, which is within the guidance for the year of a drop of 10% to 12%.

One of the pressure points for earnings was the negative rent reversion percentage in South Africa. Although it has improved from -12.9% to -6.0% this year, the reality is that the average lease is being concluded at a discount to the expired lease. Growthpoint’s substantial office exposure continues to be a headache here.

Interest rates were a major issue, as was expected. The total cost of funding jumped by 16.2%, which is even higher than the growth rather that the V&A Waterfront could achieve, let alone the rest of the group. Group loan-to-value has increased from 40.1% to 42.3% and investors will want to watch this carefully.

Net asset value (NAV) per share decreased by 6.1% to R20.20, with negative valuation trends in Australia. Growthpoint’s share price trades at around R14.50 at the moment, so there’s a discount to NAV of nearly 30%. Broad exposure to the property market and investments in other tradeable entities (like Capital & Regional) inevitably lead to a discount at top level.

Based on the full-year dividend of 117.1 cents, Growthpoint is trading on a yield of roughly 8.1%. This shows the disconnect between NAV and distributable income per share. The discount to NAV looks juicy, yet the yield does not.

Looking ahead, major redevelopment work at the V&A Waterfront is planned for 2025. This is the right decision long-term, but it will have an impact on earnings in the near-term.

In my view, Growthpoint would do well in this environment to increase the relative South African exposure by reducing offshore exposure. It simplifies the group and the balance sheet and would probably be helpful in reducing the discount to NAV per share.

There’s a lot of activity around Capital & Regional and potential buyers sniffing around the asset, with news hot off the press that Praxis is pulling out of the process. This leaves one potential buyer at the moment and a great example of why speculating on a bidding war is dangerous.


Hyprop is down this year, but by less than they thought (JSE: HYP)

And there will even be a dividend!

Hyprop definitely won the First Panicker award when it came to Pick n Pay. At a time when other property funds were merely highlighting the risk, Hyprop went all out in getting rid of the dividend. Given the risky acquisition of Table Bay Mall, there was a school of thought in the market that Pick n Pay was just a convenient excuse to buy Hyprop more time for balance sheet flexibility. Either way, the market wasn’t pleased.

In a trading statement for the year ended June, we now know that distributable income per share has fallen by 8.7%, which is a lot better than the guidance of a drop of 15% to 20%. Behold, Pick n Pay hasn’t quite disintegrated away into nothingness!

This means that there will be a dividend, as there really is no justification whatsoever not to pay a final dividend. They expect to pay 280 cents, which implies a yield for the year of a paltry 6.8% on the current share price. They only pay 75% of distributable income as a dividend, which explains why that yield is much lower than the typical income yield achieved on these funds.


Murray & Roberts is still loss-making, but looks much better (JSE: MUR)

The order book has also moved higher

Murray & Roberts is busy with a tough recovery story. They have to claw themselves back from a really difficult position, which they are managing to do slowly but surely. The headline loss per share from continuing operations has reduced from -71 cents to -24 cents for the year ended June 2024. A long way to go, but the direction of travel is good.

Speaking of a positive trajectory, the order book has increased from R15.4 billion to R17.2 billion. This bodes well for what should be a vastly improved FY25, with the balance sheet also on a much strong footing in a net cash position of R0.4 billion vs. net debt of R0.3 billion a year ago.

This net cash position does include advance payments, so they aren’t out of the woods just yet and still have work to do on the balance sheet. Currently, there is a term sheet in place to extend the banking facilities to January 2026, giving them time to settle the debt. Until the term sheet is a binding agreement, there’s risk.


Mustek had a really tough year (JSE: MST)

The end of load shedding helped most businesses – but not Mustek

The abrupt and unexpected end to load shedding caused havoc for those plucky entrepreneurs who had built businesses around trying to provide South Africans with energy solutions. They were suddenly left with expensive overheads and tons of stock lying around, as the vast majority of people wanted solar and energy solutions because they missed watching TV, not because they actually care enough about the environment to spend the same amount as an overseas trip on a solar solution.

Mustek was one of the casualties in this story, with HEPS for the year ended June expected to drop by between 70% and 80%. It wasn’t just because the income from energy products dried up. They also had to deal with the uncertain environment leading up to elections and the impact this had on demand.

This means that HEPS will only be between 75 cents and 112.50 cents vs. the share price of R13.49. It’s amazing how a low Price/Earnings ratio can quickly unravel into something that looks expensive.


Pan African Resources had a strong year (JSE: PAN)

Here’s a gold mining group that took advantage of better prices

Pan African Resources has released results for the year ended June. Gold production increased by 6.2%, so they certainly made hay (or gold?) while the sun was shining. Despite this, all-in sustaining costs came in slightly above guidance at $1,354/oz, with guidance having been given to the market of $1,325/oz – $1,350/oz. Nonetheless, revenue increased by 16.8% thanks to the combination of higher production and gold prices, with HEPS increasing by 32.2%.

Guidance for 2025 is for all-in sustaining costs of between $1,350/oz and $1,400/oz, so there’s an expectation of inflationary pressures over the next 12 months as one would expect.

In terms of major projects, steady-state production at MTR is expected by December 2024, with commissioning in progress. Another important strategic initiative has been to increase the Barberton Tailings Retreatment Plant’s life-of-mine to 7 years, an increase of 5 years. Production guidance for 2025 is 215,000oz to 225,000oz, which is way up on the current level of 186,039oz and a result of the steps taken to increase capacity at the group.

Expansion comes at a price, with net debt up considerably from $22 million to $106.4 million. Another decent year of gold prices will do wonders here.


Super Group’s profits were anything but super this year (JSE: SPG)

The automotive sector and the European supply chain exposures are weighing on results

Super Group has released results for the year ended June. It wasn’t a happy time for the group, with HEPS down by 25.9% despite revenue increasing by 4.6%. Even operating cash flow decreased by 3.4%, so there wasn’t any kind of working capital unlock to try and soften the blow.

The challenges are being felt in the European supply chain businesses and the UK-based dealership businesses. With 56% of group revenue and 54% of operating profit coming from the offshore operations (including others like in Australia and New Zealand), it’s tough for South Africa to offset a difficult performance across the various ponds – especially when things aren’t smooth sailing here as well, with profits down in Dealerships SA and Supply Chain Africa.

The group outlook has some worries in it, like the impact of poor port performance in South Africa on the volumes in the Supply Chain Africa business. Irritatingly, Transnet’s general levels of uselessness have led to certain supply opportunities being lost for the foreseeable future, like copper exports that are now going through Dar es Salaam and Walvis Bay. Supply Chain Europe is facing its own issues, particularly due to the automotive sector in Germany being under immense pressure at the moment.

In SG Fleet, which has had two strong years in a row, the expectation is for a dip in earnings as new vehicle availability improves and used car prices come under pressure. With an interest rate swap set to mature, they also expect higher interest costs on corporate debt.

Dealerships SA and Dealerships UK are both dealing with disruption in the automotive sector from changing consumer preferences and the strength of Chinese brands, although the Super Group commentary seems to gloss over this issue in the prospects section. I’m worried about that sector and I will be interested to see how things play out there.

The most positive narrative is in Fleet Africa, with a focus on the private sector and increased activity in general. This business is nowhere near big enough to move the dial at group level. For context, it generated profit before tax of R265 million in FY24 vs. a loss before tax of R1.51 billion in Supply Chain Europe.


Little Bites:

  • Director dealings:
    • A senior executive of Investec (JSE: INP | JSE: INL) sold shares worth R18.3 million.
  • Lighthouse Properties (JSE: LTE) has now closed the deal for the acquisition of a mall in Portugal. The deal was previously announced in July. A 7-year loan at a cost of 4.48% over the period has been secured. They are buying the property on a net initial yield of 7.2%, so the deal is cash positive from the start.
  • If you have a position in Mr Price (JSE: MRP), keep in mind that the company is hosting its capital markets day during the end of this week. Depending on what comes out there, we might see a reaction in the share price.
  • The proposed Richemont (JSE: CFR) dividend of CHF 2.75 per share has been approved. It works out to around R34.75 per share net of withholding tax. The payment date is 30 September.
  • Inexplicably, Sable Exploration and Mining (JSE: SXM) now needs to pursue a voluntary disclosure process with SARS as PAYE was not previously withheld from director salaries. The market cap of this company is only R12 million and I couldn’t even get the website to work.

Ghost Bites (Anglo American | Anglo American Platinum | AngloGold | Attacq | Bowler Metcalf | Caxton | Libstar | Old Mutual | Texton | Vukile | WBHO)

2

Get the latest recap of JSE news in the Ghost Wrap podcast, brought to you by Mazars:


Anglo American is calling all pockets for its Anglo American Platinum stake (JSE: AGL | JSE: AMS)

Instead of just unbundling the full stake, they are selling some of it first

The latest trend on the JSE seems to be a placement of shares in a subsidiary, following by an unbundling of the remaining shares. The rationale varies from group to group, but this is proving to be a powerful way for a group to unlock some cash and then release the rest of the stake to shareholders.

Anglo American is taking this route with its 78.56% stake in Anglo American Platinum. Amplats is already listed of course, so getting institutional investors to take a piece of that stake before an unbundling is going to require some incentivisation in the form of price. Anglo American wants to sell approximately a 5% in Amplats through an institutional placement, with the rest due to be unbundled to shareholders at some point in the future.

They’ve appointed three major banking groups, both locally and abroad, to try and get this placement done. The PGM sector is in disarray at the moment, so it’s going to be really interesting to see what the market demand looks like – and especially at what price. Naturally, unless you’re an important institutional investor, your phone won’t be ringing with a call from the banks.


AngloGold looks for riches in Egypt (JSE: ANG)

The group is acquiring Egypt’s largest and first modern gold mine

AngloGold has announced that it is acquiring Centamin, a gold producer whose flagship asset is the Sukari gold mine in Egypt. If the deal goes ahead, Centamin shareholders will be paid a combination of AngloGold shares and cash, giving them a premium of 36.7% to the closing price on 9 September. Centamin shareholders will also be eligible to receive the dividend due to be paid on 27 September.

To give an idea of just how large this deal is, Centamin shareholders will hold 16.4% in the enlarged AngloGold group after the deal. In return for allowing this dilution, AngloGold shareholders will be invested in a high quality gold mine that will reduce group costs per unit of gold produced. The deal will also be free cash flow per share accretive from the very first year.

For the deal to go ahead, Centamin shareholders will need to vote in favour of it. The Centamin directors have unanimously recommended that Centamin shareholders do exactly that. The directors have also given irrevocable undertakings to vote in favour, but their ownership stake is immaterial in the group context.

As usual, there are also regulatory hurdles to overcome. These deals aren’t simple and they don’t happen overnight.

If you’re interested in learning more, you’ll find the corporate presentation on the deal here.


Attacq achieved great growth in this financial year (JSE: ATT)

Nobody can be upset about 19% growth in the full-year dividend

Property fund Attacq has released results for the year ended June 2024. The TL;DR is that distributable income per share increased by 19.9% and the full-year dividend was up 19.0%. With that kind of growth in the key metric for a property fund, it feels like we barely need to read any further.

One thing that always needs to be checked is the balance sheet, particularly the loan-to-value ratio. Thankfully, that has improved from 36.8% to 25.3%.

In terms of capital allocation, the focus has been on the acquisition of 20% in Mall of Africa as well as further additions to investment property. On the disposals side, the notable move was to sell the remaining 6.45% investment in MAS for R773.1 million.

The share price return over the past 12 months of around 60% is a pretty great summary of the recent momentum not just in the sector, but in Attacq itself.


Bowler Metcalf had a spectacular year (JSE: BCF)

And no, this isn’t just a year-on-year fluke thanks to a soft base

Bowler Metcalf is one of the better small caps on the JSE, although they’ve certainly had a tough couple of years in the build-up to this excellent result. Still, the 57% increase in HEPS for the year ended June 2024 isn’t just because 2023 was a weaker year than the preceding few years. At 161.38 cents in HEPS, they are running well above even the 2021 level of 127.31 cents.

This result was driven by a 10% increase in revenue, with the group also managing to become more efficient over time and increase its return on equity to 13.4%. That’s the highest level in any of the recent years, indicating that the group is going from strength to strength. After substantial capital expenditure in 2024 and a decent pipeline into 2025, it seems there’s a strong chance that they could beat the record cash generation achieved this year.

The share price has limited liquidity, so caution is needed around the bid-offer spread and position sizing. The share price is up around 60% in the past 12 months, so those who decided to stomach the small cap risk have been well rewarded.


Caxton gets a rap over the knuckles from the JSE (JSE: CAT)

The exchange is unhappy with announcements released by Caxton in 2022

Those who have followed Caxton and Mpact closely over the past couple of years will know that the relationship between the companies is less than friendly, despite Caxton being heavily invested in Mpact.

Among many rather colourful things that happened along the way, Caxton released announcements on 12 August 2022 and 6 October 2022 that included all kinds of statements related to Caxton’s views on Mpact’s alleged behaviour and how the packaging market works. There were all sorts of allegations and pseudo-allegations that were made, which the JSE feels were not in line with the requirements for the use of the SENS platform. Caxton had no direct obligation or legal duty to make the statements about another listed company, with the JSE clearly wanting to put a stuff to fights like these over SENS.

Caxton got away with a public censure rather than a fine as well. The company has also been forced to retract the specific statements made over SENS.


Despite negative volumes, Libstar grew revenue and improved its margins (JSE: LBR)

This is the power of being able to put through pricing increases

Libstar has released results for the six months to June 2024. The revenue growth of 5.2% won’t set your pants on fire, but it’s worth digging deeper into that number to note that selling price inflation and mix contributed 5.4%, with volumes down 0.2%. That’s an interesting outcome.

The ability to put through pricing increases helped grow gross margin from 21.2% to 21.5%, assisted by cost management as well. That’s just as well, as operating expenses increased by 8.2% with insurance costs as a major pressure point, along with the usual suspects like salaries and wages. This means that the gross margin improvement was largely offset by expense growth, leading to normalised operating profit only growing by 5.3% and showing negligible improvement in margin.

Normalised EBITDA has increased by 13.4% and that margin increased from 7.2% to 7.7%. This tells us that depreciation was higher in this period than the prior period.

Another good news story is that net finance costs have decreased by 11.1%, thanks to lower average borrowings during the period. The debt to EBITDA ratio improved from 2.1x to 1.6x, way below lender covenants of 2.5x.

This decrease in finance costs helped drive an improvement in normalised HEPS of 11.4%. HEPS calculated without the normalisation adjustments was 32.4% higher, but this is affected by foreign currency and other moves.

If there’s a downer in this result, it’s on the cash generated from operations line which showed very little growth despite the uptick in earnings. This is because of the higher stock levels in the group and shipment delays that are making this difficult.

The group has been through a major strategic rethink and the results are clearly showing here. They’ve made a number of changes to the internal structure and reporting lines. The earnings announcement was also accompanied by the news that Libstar sold its interest in Chet Chemicals, which is part of the Household and Personal Care category. The buyer is a company called Mithratech, which is a subsidiary of Morvest Group.

With Libstar generating over 94% of its revenue from perishable and ambient products, this business just isn’t a great strategic fit within Libstar and doesn’t sit well with a strategy to simplify things. As the deal is so small, they haven’t disclosed the selling price.


Uninspiring numbers at Old Mutual, despite what we’ve seen at financial services peers (JSE: OMU)

There are no Sanlam growth rates happening here

Old Mutual has released a trading statement for the six months to June. At a time when other financial services groups are releasing exceptional numbers, I’m afraid that there’s no excitement here. It seems as though the Personal Finance segment was the problem, specifically in the life business. Group overheads also played a role here, with those challenges offsetting the performance in Old Mutual Insure, Old Mutual Corporate and the Mass and Foundation Cluster.

Old Mutual’s preferred performance metric is adjusted headline earnings, which put in a move of between -2% and 8% for the interim period. The midpoint of that is positive at least, so it’s a disappointing period rather than a poor period. Adjusted HEPS is up by between 2% and 12%. Although it’s potentially an inflation-beating performance, it doesn’t look good relative to what we’ve seen elsewhere in the sector.

Sanlam’s share price is up 25% in the past 12 months and Old Mutual is down 0.4%.


Texton sells a UK property below book value (JSE: TEX)

They plan to recycle the capital – but into what?

Here’s the funny thing about Texton: with the share price at R3.90 and the net asset value (NAV) per share sitting much higher at R7.12, they could sell off all their assets at a pretty significant discount to book and still create value for shareholders – provided they return the capital to those shareholders.

Sadly, I don’t think we will see that happen. When Texton talks about recycling capital, they inevitably mean investing it in US-based property funds. This is why the discount to NAV probably isn’t going anywhere.

Perhaps they will shock me with the proceeds from the sale of the Heapham Road Industrial Estate in Gainsborough in the UK. The disposal price is £7.3 million and the value of the asset was disclosed as £8.25 million as at June 2023, so although they’ve sold it at a discount to NAV, they’ve technically sold it at a premium to what the share price is implying.

Let’s see what happens next with this capital.


The market is supporting the Vukile story (JSE: VKE)

My bullishness on property in this market cycle continues

Something that makes me happy as a holder of the REIT sector in general: market support for capital raising initiatives, like we’ve just seen at Vukile.

Something that irritates me as a holder of the REIT sector in general: the fact that institutions will always participate in these capital raisings at a discount, which means retail investors are diluted by more than they should be.

I understand why companies do it though, especially when they are looking to quickly raise the capital and get on with things. If you’re going to include retail investors as well, you can’t raise R1.5 billion overnight. Just consider that for a moment: R1.5 billion raised in the time that it took people to have dinner and then breakfast.

Vukile initially wanted to raise around 5% of its market cap, but increased that to 7.7% based on demand in the market. The placement is at R17 per share, a discount of 4.6% to the pre-launch closing share price. Without the discount, it’s a lot harder to get institutions to bite at the cherry, which is why the challenge of dilution in capital raisings isn’t about to disappear.

At least in the case of Vukile, the discount is manageable because there is solid demand for the shares. When we get near the top of the cycle, even the less successful funds will be able to raise capital at minor discounts. When that starts happening, it’s time to take profit on the REITs and move on to something else.

For now, I’m still strongly invested in the property sector in my tax-free savings account and I’m quite happy with that situation.


WBHO has grown earnings and declared a dividend (JSE: WBO)

This is why the share price is up 85% in the past year

If you’re looking for a feel-good story about SA Inc, this one just might do it. Construction group WBHO has grown revenue from continuing operations by 16% for the year ended June 2024. That’s a good start to the income statement, leading to a great outcome like HEPS from continuing operations jumping by 18.7%.

There’s a final cash dividend of 230 cents per share, which is a whole lot better than nil cents per share in the comparable period. This tells you just how much things have improved in the industry, although I must point out that the order book has decreased from R32.6 billion at June 2023 to R30.6 billion at June 2024.

It’s not every day that a share price marches with this enthusiasm towards the top right-hand side of the page:


Little Bites:

  • Director dealings:
    • A director of a major subsidiary of Tiger Brands (JSE: TBS) received shares worth R1.43 million and appears to have sold the entire lot, as no mention is made in the announcement of this being only the taxable portion.
  • NEPI Rockcastle (JSE: NRP) has released the details of the scrip dividend alternative. The default option is a capital repayment rather than a cash dividend or scrip issue, with both those alternatives available as well. The decision will mainly come down to the different tax consequences.

A responsible investing roadmap

Listen to the podcast here:


Given the lack of global ESG standardisation and its politicisation, how should investors approach responsible investing and measure its impact?

Investec Wealth & Investment International has launched a comprehensive guidebook on the topic. In the latest episode of the No Ordinary Wednesday, Jeremy Maggs speaks to the authors, Boipelo Rabothata, ESG Specialist and Co-Fund Manager of the Investec Global Sustainable Equity Fund and Maxine Gray, Business Strategist at Investec Wealth & Investment International.


Also on Spotify, Apple Podcasts and YouTube:

Ghost Bites (AVI | Bell | Capitec | Sun International | Trematon | Vukile | Wesizwe Platinum)

0

Get the latest recap of JSE news in the Ghost Wrap podcast, brought to you by Mazars:


AVI loves offering coffee and biscuits (JSE: AVI)

You won’t find a more attractively shaped income statement move than this one – but do they need all those divisions?

In investing, what you really want to see is a company that can turn a modest revenue result into an excellent profit result. In other words, a shape on the income statement that sees a small percentage revenue increase leveraged up into a much larger percentage move in profits. This leverage comes with risk of course, as it tends to work just as effectively in reverse, which means things can get tough when revenue drops.

There’s no reward without risk. That’s how finance works.

In the year ended June, there was plenty of reward at AVI. From revenue growth of just 6.3%, they grew gross profit by 13.5% (hence margins went up) and HEPS by 24.1%. Considering the challenges still being faced in the I&J business, that’s really good. Cash quality of earnings is also clearly there, with the dividend up 22.4%.

We need to look deeper to really understand the results, starting with the food and beverage brands. Entyce Beverages and Snackworks both grew revenue, up by 18.2% and 6.4% respectively. They achieved profit increases of 41.3% and 22.4%, with a combined jump of a wonderful 31%. This helped make up for I&J, where revenue was down slightly and profit increased by 1.5%.

Over at Personal Care, a focus on margins rather than revenue means that although revenue fell by R200 million year-on-year, profit was down by just R10 million. That’s a far more efficient business, with the Coty business now out of the system and unlikely to be missed.

The Footwear & Apparel segment could only manage revenue growth of 3.6%, while profits fell by 3.9%.

So in reality, Entyce Beverages and Snackworks are pretty much carrying the team right now. AVI includes a great chart in the earnings report that makes this point loud and clear:

In summary, the coffee, creamers and biscuits are doing very well, thank you. The fish catch rates are a challenge at 20-year lows, with further pressure on I&J from the abalone market and its supply and demand dynamics. As for Personal Care as well as Footwear & Apparel, one can only dream of a world in which AVI gets great offers for those businesses and simplifies its group accordingly.

Diversification is a thing, but so is diworsification.


Unimpressive numbers at Bell – and just as shareholders need to weigh up the buyout offer (JSE: BEL)

There’s food for thought here for those who believe the offer price should be higher

From what I’ve seen on X, the scheme of arrangement at Bell is by no means a guaranteed success. Because of the shape of the shareholder register, there are a couple of shareholders who can swing the vote. The deal is a game of cat-and-mouse, yet the new earnings information looks like somebody moved the cheese entirely.

After releasing generally strong results in the past couple of years, Bell could only manage revenue growth of 6% for the six months to June. Even worse, operating profit was down 2% and HEPS fell by 6%. None of that is good news. There’s no dividend per share due to the potential corporate action.

There are a number of important underlying initiatives underway, like the growth in manufacturing capabilities at the German factory and the launch of the new motor grader product. As great as that sounds, it needs to be balanced against the softer commodity and construction cycles, with Bell always exposed to the level of investment by players in those sectors.

Despite inventory levels remaining elevated across the industry, Bell did at least generate net cash of R80.5 million for the period. That’s a vast improvement on the nearly R400 million in cash that was absorbed in the comparable period.


Capitec just doesn’t stop growing (JSE: CPI)

These are seriously impressive numbers

Capitec has released a trading statement for the interim period to 31 August. This is an update to the previous announcement in July that suggested earnings growth of between 25% and 35% for this period.

It’s even better than that, with the updated earnings giving a much tighter range of 35% to 37% – which means they had an even stronger finish to the period than they anticipated.

Detailed results are due on 1 October. These are great numbers that the market will dig into in detail, with Capitec’s share price up more than 4% for the day and nearly 50% this year!


Sunbet is the growth highlight at Sun International (JSE: SUI)

The group result isn’t too shabby either

Sun International has released results for the six months to June. With adjusted HEPS up by 9.1% and the interim dividend up 8.8%, this is a decent if not spectacular result.

There are slow growing parts of the group, like gaming income up just 3.4%. As this contributed 77.4% of group income, it explains why the overall growth in income was just 5%. Urban casinos grew just 2.2% and smaller regional casinos couldn’t even match that number. The highlight, by far, was Sunbet: 71.8% growth and running ahead of targets.

A decent runners-up trophy goes to hospitality income, which was up 12.3%. People seem to want to stay at the casinos but aren’t so keen on actually gambling!

The wooden spoon? Sun Slots, where income fell by 4.3%. For context, Sun Slots contributed income of R686 million vs. R512 million at fast-growing Sunbet.

Despite the underlying mix effect, group adjusted EBITDA margin was consistent at 27.3%. This helped decrease debt (excluding IFRS 16) from R5.7 billion at December 2023 to R5.4 billion at June 2024. Despite the drop in debt, the interest charge increased by 2.7% due to higher rates.

The acquisition of Peermont Holdings is still underway, with regulatory approvals still being obtained. Credit approved funding has been received from lenders. The casino businesses aren’t achieving much growth right now, but they remain great cash cows that are capable of servicing debt.


Trematon is selling Aria (JSE: TMT)

Now we know why the company was trading under cautionary

Trematon has turned an investment into cash, with the 60% stake in property group Aria being sold for R293 million. The deal is being structured as a share repurchase, so the other shareholders in Aria are effectively taking Trematon out of the picture.

Trematon’s net interest in Aria’s assets as at 29 February 2024 was R274.2 million, so this deal is at a premium to that number. Admittedly, that number is now 5 months old, so one would hope that there was growth over that period.

Aria holds a portfolio of 13 properties, almost exclusively in the Western Cape. They include commercial, retail and industrial properties.

I think this is a good move, Trematon’s net asset value per share as at the end of February was R3.39 and the current share price is R2.44. If the cash from this disposal is used for share buybacks, it should help close the gap.


Vukile gets more exposure to Iberia through the Portuguese market and looks to raise equity capital (JSE: VKE)

Iberia seems to be the new Poland for locally listed property funds

It’s funny how things seem to happen in waves when it comes to JSE-listed property funds. At one point, all we could hear about was the UK. Then, Eastern Europe was in vogue, a push which turned out far better than most of the UK acquisitions. These days, Iberia is in fashion, with Lighthouse Properties putting its focus in the region and Vukile deepening its exposure there.

To be fair to Vukile, they’ve already been in Spain as their international growth story for a long time. 99.5% held subsidiary Castellana Properties is now venturing into Portugal, announcing the acquisition of three properties in the country on a initial net income yield of 9%.

This is a deal with one seller across the three properties. To facilitate it, Castellana will set up a new subsidiary that will be 80% held by Castellana and 20% held by an RMB entity. Our local bankers are smart enough to see the opportunity in Iberia and participate in it.

The three properties are all shopping centres, with two in Lisbon and one just outside of Porto. Interestingly, a retailer named Continente Hypermarket is the anchor tenant in all three, so hopefully they won’t be having any Pick n Pay experiences over there.

The purchase price is EUR176.5 million and acquisition costs are EUR4.4 million. Existing lenders will refinance an in-country asset-based debt package of EUR72.5 million and the remaining EUR104 million will be funded by equity, with 80% coming from Castellana and 20% from RMB. It’s interesting to see the bank playing in the equity section of the capital stack in this deal.

This is a category 2 deal, so there will not be a circular issued to shareholders.

Late in the day, Vukile also announced an accelerated bookbuild to raise equity representing approximately 5% of the company’s market cap. This implies a raise of over R1 billion, with the right to increase the raise if there is strong demand. As usual for funds this size, selected institutions will be able to buy shares (probably at a discount) and retail investors will watch from the sidelines.

Although the announced acquisitions in Portugal are fully funded, Vukile is looking to raise a warchest for further acquisitions. This is typical behaviour of a property fund that really has the wind in its sails, so just be cautious of how this share price behaves and the valuation that it gets to.

I found it incredibly interesting that although Vukile is investing alongside RMB in Portugal and has Java Capital as its sponsor, it has appointed Investec as the bookrunner for the capital raise. Welcome the The Corporate Bachelor, with the zebra getting the rose this time!


Wesizwe Platinum’s operational update has unusual stuff in it (JSE: WEZ)

Aside from concentrator plant issues, there’s also an odd outcome for the retrenchment process

Let’s start with Weziwe Platinum’s concentrator plant, which has some problems. During hot commissioning, defects were identified and experts needed to be appointed to fix it. This won’t be a quick problem, with the plan only commencing in the fourth quarter.

Another major bit of operational news is that the s189 retrenchment process at Bakubung Platinum Mine has been concluded. It’s an unusual outcome, with 345 redundant positions and only 13 employees actually being retrenched. The rest left under natural attrition or voluntary separation packages, or transferred to in-house vacancies. And of the 13 employees, 7 are being absorbed by the company’s training services provided. It’s not common to see so few retrenchments vs. the number of redundant positions.

Speaking of Bakubung, the production ramp-up will commence in Q1 2025. The concentrator ramp up will commence in Q4 2025, with the rectification work needing to be completed first. Mining is a complicated beast.


Little Bites:

  • Director dealings:
    • Titan Premier Investments, one of Christo Wiese’s main investment companies, acquired shares in Brait (JSE: BAT) for R332k.
    • To help with cash preservation at Orion Minerals (JSE: ORN), the non-executive directors are taking a portion of their director fees in shares rather than cash. 1,625,000 new shares have been issued in that regard, worth just over R300k at the current market price.
  • Grand Parade Investments (JSE: GPL) released a trading statement for the year ended June. HEPS is up by between 640% and 660%, with that rather daft percentage being due to the costs of the restructuring transactions in the base period. Less important than the percentage move is the range for HEPS of 18.94 cents to 19.46 cents for the year. The mid-point implies a Price/Earnings multiple of 17.7x, which tells you that the group is trading based on the value of underlying investments rather than the current earnings.
  • DRA Global (JSE: DRA) has been in a legal dispute over the ironically named Mount Pleasant Project. There’s nothing pleasant or cheap about fighting in court, with DRA ordered to pay Mach Energy Australia a total of $96 million in three tranches over two years. This is in full and final settlement of the claims. After existing provisions and insurance, DRA will have to recognise additional expenses of A$30 million to A$40 million in the 2024 numbers. At least it finally brings an unpleasant situation to a close.
  • The scrip dividend alternative at Lighthouse Properties (JSE: LTE) was strongly supported, with take-up of roughly 73% of the total number of shares that were available to be issued as an alternative to cash dividends. It’s always worth remembering that these scrip dividends are like miniature rights issues, so they preserve cash for the group but put pressure on per-share metrics like dividends per share going forward.

Ghost Bites (African Rainbow Minerals | Calgro | Caxton | City Lodge | Clientele | Momentum)

0

Get the latest recap of JSE news in the Ghost Wrap podcast, brought to you by Mazars:


African Rainbow Minerals has released full details on a difficult year (JSE: ARI)

The cycle hasn’t been kind here

When assessing the performance of a mining group, the most important thing is to understand the underlying commodity exposures. This table does a great job of showing not just the different segmental contributions at African Rainbow Minerals, but also the impact of a terrible year for the PGM industry:

With that level of exposure to PGMs, it’s little wonder that HEPS fell by 43% to R25.91 per share. The dividend is also down 43%, but at least there is still a dividend despite the challenges. This is thanks to the health of the balance sheet, with a net cash position of R7.2 billion, admittedly a fair bit down from R9.8 billion 12 months ago.

The PGM sector troubles continue, with the group taking steps like putting the Two Rivers Merensky project into care and maintenance from July 2024. Unsurprisingly, this comes with a substantial impairment of over R1 billion that is excluded from HEPS. Bokoni Mine is a cautious ramp-up strategy, with the board having now approved the construction of a chrome recovery plant.

There’s a lot of corporate activity around copper at the moment, with African Rainbow Minerals also getting in on the action. They took a 15% stake in Surge Copper Corp on 31 May. This is a Canadian group with resources of copper, molybdenum, gold and silver. 15% doesn’t exactly give them much influence there, but it’s a start.


Sudden management changes at Calgro (JSE: CGR)

The share price was surprisingly unresponsive to this

Calgro released a shock announcement that Wikus Lategan and Waldi Joubert will be leaving the group to pursue other interests. Wikus was the CEO and Waldi was very much his right-hand man and ex-CFO, running the Memorial Parks business. Thankfully, current CFO Sayuri Naicker isn’t going anywhere.

The change is with effect from 31 December 2024, so there isn’t a lot of time here for a handover. Ex-CEO Ben Malherbe will return to the CEO role. As one of the co-founders of Calgro, he certainly knows the business. The other change to the board is that Allistair Langson, Calgro M3 Developments Limited Managing Director, will be appointed to the group board as an executive director.


Caxton is on a treadmill at the moment (JSE: CAT)

Publishing and printing isn’t exactly a land of milk and honey at the moment

Caxton and CTP Publishers and Printers, or just Caxton for short, released results for the year ended June. Revenue fell 47% and operating profit after depreciation was down 11.4%, with the company buckling under the pressure of reduced printing throughputs and a decline in media advertising revenue from national retailers.

I still find it amazing that such a big piece of Caxton’s business is based on retailers being willing to print their specials for inclusion in community newspapers. That doesn’t sound sustainable to me. This division saw operating profit after depreciation fall by over 18%. It contributed 37% of group operating profit, down from 40% the year before.

In the packaging business, revenue at least managed to grow. Operating profit can’t say the same thing, dropping roughly 15% year-on-year. I’m not sure what’s worse: the revenue trajectory in the printing business or the margin trajectory in packaging!

Although Caxton did its best in containing costs like salaries, the reality is that this isn’t known as a bloated operation and they can’t just keep shrinking costs forever to try and address the revenue problem. These are band-aid strategies that don’t fix the underlying wound.

The drop in operating profits was largely offset by insurance proceeds received in this period as well as a sharp jump in net finance income thanks to the size of the group’s cash balance (R2.5 billion vs. R1.9 billion at the end of the comparable period).

These offsetting factors helped HEPS increase by 4% despite the rough operating performance. The dividend was flat at 60 cents per share. The lack of growth in the dividend tells us quite a bit about the underlying concerns in the business.

And yet, the market seems to think that something big is about to happen at Caxton, with a massive rally being driven by speculation that a major corporate action could be on the table. The source of that speculation? A SENS announcement on 3rd September that Peregrine Capital now holds 9.6% in the company. For the market, that’s enough to believe that a buyout offer could be coming, with the share price now looking like this:


City Lodge had a tougher second half (JSE: CLH)

The market didn’t like it, with a 5.5% drop on the day

The City Lodge share price is a volatile thing, with sharp moves that can make paupers and kings out of traders:

As you’ll see on the far right there, the correction after the release of annual earnings was significant. For the year ended June, City Lodge managed revenue growth of 13% and HEPS growth of 10% as reported or 37% on an adjusted basis. Those don’t exactly sound like bad numbers, do they?

Average group occupancy moved 200 basis points higher to 58%, so that’s also encouraging news. We can’t even say that the cash quality of earnings was poor, as the dividend increased by 15%.

Other important data points include the lack of debt on the balance sheet (and that’s a big deal), as well as the growth in food and beverage revenue of 22%. That revenue line now contributes 19% of total revenue, which is an impressive part of the investment case. It’s also great to see that gross margin in the food and beverage business moved 200 basis points higher to 60%.

Excluding foreign currency moves, adjusted EBITDAR margin improved from 30.1% to 30.4%. City Lodge increased room rates by 8%, helping to offset some major inflationary pressures in the cost base.

So, what didn’t the market like? The likeliest culprit seems to be the second half performance, which took the shine off a really good first half where occupancy was up around 800 basis points. Between November and June 2024, occupancy fell by 100 basis points, with the lack of consumer and business confidence in the run-up to elections no doubt playing a role.

The 2025 financial year hasn’t gotten off to a good start, with occupancy down by a most unfortunate 500 basis points year-on-year in July. The August drop was 600 basis points. Although the first week of September was thankfully in the green, that’s not really a long enough period to make a call.

Logically, in an environment with improved business confidence and activity, City Lodge should be a beneficiary. The company has been through so much and is now on the strongest footing I’ve seen, with a clean balance sheet and plenty of evidence that the food and beverage strategy is working. The valuation is a challenge though, with the Price/Earnings multiple at around 14.6x based on adjusted HEPS.

I’ve seen arguments in the market that the group should be valued based on the replacement cost of the hotels. I don’t agree with that approach. If the hotels can’t generate sufficient economic returns, they wouldn’t be built as hotels in the first place and won’t change hands at replacement cost. This is why I believe that it should always come back to earnings, with City Lodge’s current valuation looking a bit demanding for now.


IFRS17 contributes to a notable decline in earnings at Clientele (JSE: CLI)

Shareholders will have to be patient for all the details

Clientele has released a trading statement for the year ended June. It’s not good, with HEPS expected to drop by between 33% and 53%. Although they note that the application of IFRS 17 has a substantial impact, they go on to say that earnings on a like-for-like IFRS 17 restated basis will differ by at least 20% – but they don’t specify up or down vs. the comparative period! As HEPS was down by 35% for the interim period, I suspect that earnings are down regardless of how you apply the IFRS 17 lens.

Oddly, because of the way that IFRS 17 works, the group’s net asset value has actually moved higher to between R1.8 billion and R2.4 billion!

Full details will only become available when results are released on 18 September. The share price has had pretty serious volatility, with a 52-week low of R9.50 and a 52-week high of R12.98. At the current level of R11.77, the share price is practically flat over 12 months despite the volatility.


Momentum also has a great financial services story to tell (JSE: MTM)

As we’ve seen elsewhere in the sector, earnings growth looks strong

Momentum Group has released a trading statement for the year ended June. HEPS is up by between 41% and 46%, so there’s nothing wrong with that. Normalised HEPS is up by between 33% and 38%, which is still great. The normalisation adjustments mainly relate to the iSabelo Trust B-BBEE scheme.

Looking at the underlying drivers of this performance, there’s a positive story almost across the board. In both the long-term and short-term insurance operations, things have gone in the right direction. The higher interest rate environment was also good for investment income.

The downer was in the venture capital portfolio, where fair value losses were experienced. I’m really not sure that dabbling in that asset class is the right move for a group like Momentum.


Little Bites:

  • Director dealings:
    • A2 Investment Partners, which has board representation at Nampak (JSE: NPK) in the form of Andre van der Veen, bought another R39.3 million worth of shares. That’s a pretty big show of faith in the progress of that turnaround story.
    • The CEO of RCL Foods (JSE: RCL) bought shares in the company worth R3.34 million. There’s no stronger signal out there than an on-market purchase!
    • Speaking of on-market purchases, Des de Beer bought another R2 million worth of shares in Lighthouse Properties (JSE: LTE).
    • A director of a subsidiary of Capital Appreciation Limited (JSE: CTA) sold vested shares worth R1.11 million. It doesn’t specifically say that this was only the taxable portion, so I assume that it wasn’t.
    • Similarly, directors of Sasol (JSE: SOL) sold share awards worth R1.3 million. The announcement isn’t explicit on whether this is only the taxable portion.
    • A non-executive director of South32 (JSE: S32) bought shares worth roughly R870k.
    • A director of a major subsidiary of RFG Foods (JSE: RFG) sold shares worth R535k. Separately, associates of a different director of the subsidiary sold shares worth around R1.87 million.
    • A director of a major subsidiary of Sappi (JSE: SAP) bought shares worth R91k.
  • There’s yet more activity on the Quantum Foods (JSE: QFH) shareholder register. This time, Capitalworks Private Equity and Crown Chickens have taken an interest of 11.44% in Quantum. For a R1.5 billion group based in the little town of Wellington, there really is a lot going on.
  • Lesaka Technologies (JSE: LSK) has announced leadership changes, with current CFO Naeem Kola moving into the COO role, with particular focus on driving synergies across the fintech businesses. Dan Smith moves from investment director at Value Capital Partners (the largest shareholder in Lesaka) into the CFO role. He has loads of M&A experience. This makes a world of sense for an acquisition-focused strategy in fintech.

Know your worth: Julius Caesar and the Veblen Effect

Most of us associate the Veblen Effect with luxury goods such as diamonds, premium alcohol and collectible watches. But as Julius Caesar proved during ransom negotiations with Cilician pirates in 75 BC, the effect is just as potent when applied to people. 

Here’s a little economic refresher before we dig into the history books: a Veblen good is something that people want more of as its price goes up. Named after Thorstein Veblen, a Norwegian-American economist who introduced the idea of “conspicuous consumption” (i.e. showing off wealth to boost social status), these goods behave differently from most things we buy. The law of demand dictates that when prices rise, demand drops. Veblen goods directly contradict this law. Higher prices make them more desirable because they signal status, which is what’s known as the Veblen Effect. On the flip side, if the price drops, these goods lose their luxury appeal and might still be out of reach for the average buyer.

You’ll typically find Veblen goods in the luxury market – think high-end designer brands, luxury cars, yachts, private jets, expensive jewellery, and top-tier fashion. These aren’t exactly the kinds of items you’d pick up at your average store (remember that article about Hermes and the Birkin bag?), and the back-room, preferred-customers-only approach 100% feeds into the appeal. The more expensive and unattainable Veblen goods are made, the more desirable they become – a concept that flies in the face of the ease of accessibility that is required to sell almost everything else. 

Now that we’re all clear on how to spot a Veblen good, see if some of the elements of the following story don’t sound a little familiar.

Julius who?

In the 1st century BCE, the Mediterranean Sea was plagued by pirates – and not the harmless-mischief-Jack-Sparrow sort either. These pirates were a serious problem that particularly affected the region of Cilicia Trachea, or Rough Cilicia, in southern Anatolia. This area soon became notorious for harbouring (wink wink) seafaring bandits who terrorised the Romans and disrupted trade across the sea.

One of the most famous encounters with these pirates occurred in 75 BCE, when a group of Cilician pirates captured a 25-year-old Roman nobleman en route to study oratory at Rhodes. To them, he was just another young lawyer whose family would no doubt pay a handsome ransom for his return. The name Julius Caesar meant nothing to them – nor would it, as the young Julius was decades away from becoming the Dictator Perpetuo who would be recognised and feared across the vast Roman empire. 

According to the historian Plutarch’s writings, this incident was merely a hiccup for Caesar, but turned out to be a catastrophic mistake for the pirates. From the outset, Caesar plainly refused to act like a captive. When the pirates demanded a ransom of 20 talents for his release, Caesar laughed and told them they had grossly underestimated his worth. He suggested they demand 50 talents instead, which they bemusedly agreed to. Caesar then sent his entourage to gather the money while he remained with the pirates, displaying an audacious level of confidence.

You can imagine how baffled these pirates must have been. Who ever heard of a hostage volunteering to increase his own ransom?

If Plutarch’s writings are to be believed, I can imagine that the pirates were soon ready to give him away for 10 talents, nevermind 20. For almost 40 days of his captivity, Caesar treated the situation as if he were an important guest rather than a prisoner. He ordered the pirates around their own ship and demanded silence when he wanted to sleep. He even sat them down to listen to speeches and poems he composed, brazenly berating them as uncultured when they didn’t respond with satisfactory levels of enthusiasm. He participated in the pirates’ games, but always as if he were the leader and they were his subordinates. Occasionally, he would nonchalantly mention that he would have them all crucified upon his release. The pirates found this amusing, assuming it was just a joke from their overconfident, eccentric captive.

But Caesar wasn’t joking. After 38 days the ransom was paid, and Caesar was released. Despite holding no public or military office, he almost immediately managed to gather a naval force in Miletus and set out to hunt down his captors. So sure were they that he was a nobody who couldn’t pose a threat to them, that he found them still camped at the same island where they had held him captive. He then went on to capture them without much resistance. When the governor of Asia hesitated to punish them, Caesar took matters into his own hands. He personally went to the prison where they were being held and ordered them all to be crucified, fulfilling the promise he had made during his captivity.

The art of self-promotion

Are you starting to see how the story of Caesar and the pirates relates to the Veblen Effect? Instead of panicking or trying to bargain his way out of a sticky situation at a lower price, Caesar did the exact opposite – he argued for the ransom to be raised. By doing so, he essentially turned himself into a Veblen good, not only in the eyes of the pirates, but in the consciousness of the broader Roman senate, through which he would later rise to the very top rank. 

We could argue that Caesar’s higher “price tag”, combined with his haughty attitude, made him seem more prestigious and powerful than he really was at that stage, which ultimately led to the pirates treating him with a mix of respect and bemusement. Just as with Veblen goods, where the allure lies in their exclusivity and high price, Caesar used the same principle to his advantage, turning what could have been a humiliating capture into a demonstration of dominance.

Editor’s note: there seem to be a lot of Caesar types on LinkedIn, which is why this ghost actively avoids that platform.

About the author: Dominique Olivier

Dominique Olivier is the founder of human.writer, where she uses her love of storytelling and ideation to help brands solve problems.

She is a weekly columnist in Ghost Mail and collaborates with The Finance Ghost on Ghost Mail Weekender, a Sunday publication designed to help you be more interesting.

Dominique can be reached on LinkedIn here.

Verified by MonsterInsights