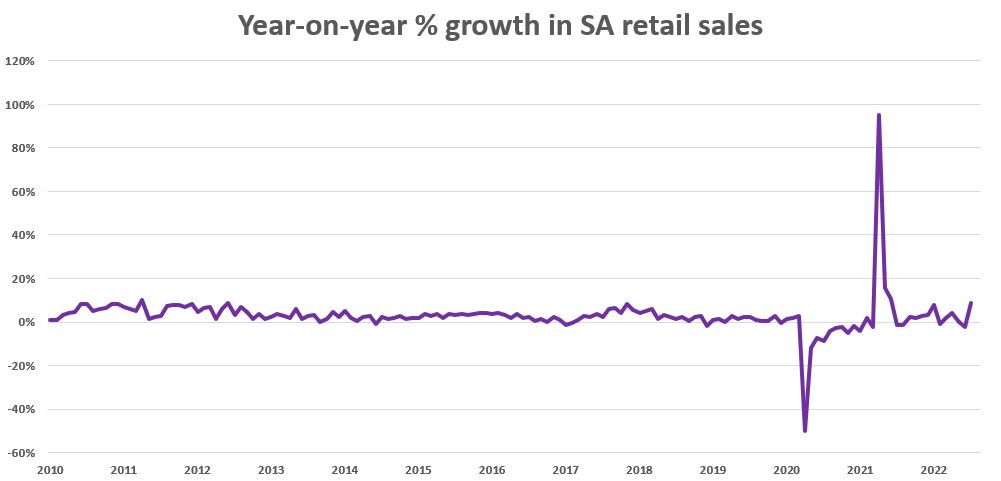
The July 2022 retail sales data from Stats SA reflects the distortion of the terrible riots in 2021. Chris Gilmour demonstrates how erratic the data has been over the pandemic vs. longer-term averages.
When I saw the July 2022 retail sales update from Stats SA, I was somewhat taken aback to put it mildly. For the month as a whole, year-on-year percentage change at constant 2019 prices was 8.6%. Not –8.6% as it could well have been, all other things being equal. But a positive 8.6%.
After a few minutes it became clear that I was dealing with a major base effect anomaly and rationalising what happened in July 2021, the penny dropped. A year earlier, the riots in KZN and parts of Gauteng had created havoc with retail sales, creating a very low base of comparison for the July 2022 figures.

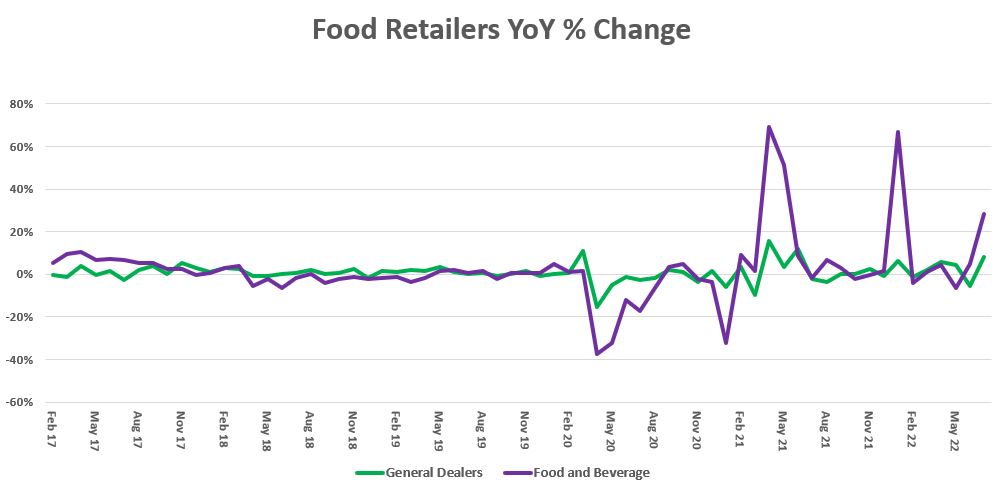
This shows up in different ways in the statistics. So for example, growth in sales at general dealers (supermarkets in the main) was a strong 8.2%. But that was nothing in comparison with sales growth at the smaller traders, categorised as “Food, beverages & tobacco in specialised stores” – that rose by a whopping 28.5%! Small traders probably bore the brunt of last year’s riots and happily they have largely come back with a vengeance.
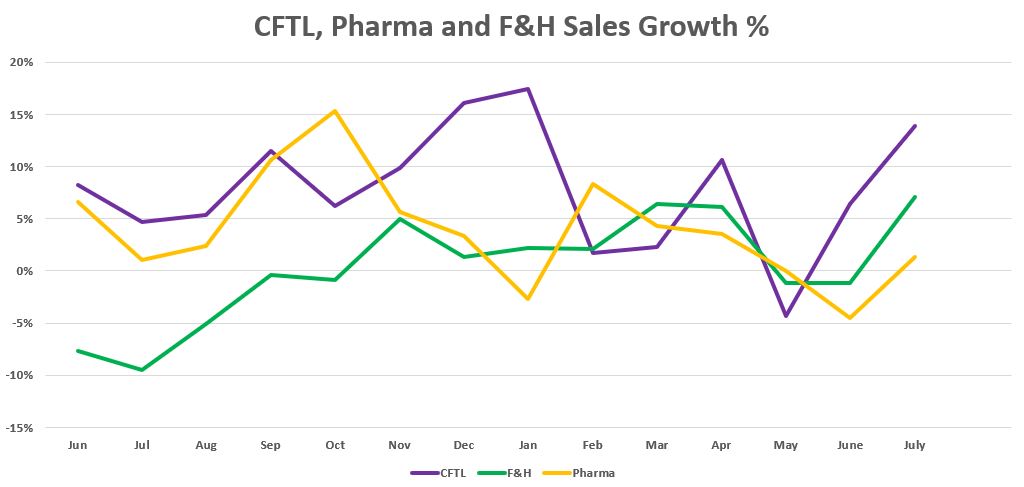
Clothing, Footwear, Textiles & Leather (CFTL) sales rose by a very strong 13.9% year on year and Household Furniture, Appliances & Equipment (F&H) sales rose by 7.1%. The looters obviously weren’t overly interested in pharmacy and cosmetic items, as they only rose by 1.3% year on year and of course DIY stores weren’t in demand by the plunderers at all, continuing their dismal decline year-on-year, with another negative print of -3%.
The following graph shows the time series of sales growth for general dealers and specialised food retailers going back five years. The two spikes in April 2020 and January 2022 were both pandemic-related and both resulted from base effects. This most recent spike will most likely be followed by a noticeable contraction the following month.

The following chart shows the time series for a couple of discretionary categories (CFTL and F&H), plus a typically stable category, Pharmaceuticals. Ceteris paribus, they should both be in steep decline by now as the impact of higher interest rates kicks in. But the July 2021 base effect is obviously distorting both. As with the previous graph, we should expect the August sales figures to exhibit a contraction in growth.

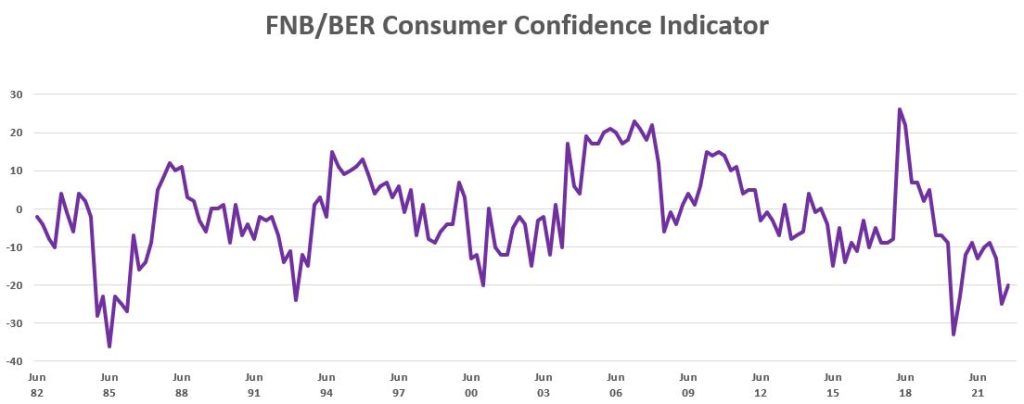
Finally, the BER/FNB Consumer Confidence Indicator. This is updated for Q3 and shows a slight improvement following the sharp deterioration in Q2. However, it is still at multi-decade lows and reflects extremely depressed consumer spending:

SARB’s MPC will give its repo rate decision next Thursday September 22 where it is widely expected that the repo rate will rise by another 75 basis point to 6.25%. Ultimately this will have a further dampening effect on consumer spending.


How credible are stassa figures?
They are pretty good actually!
Is it a good move to buy old mutual share